Summary
between(<tsExpression>, <lower>, <upper>)
Returns 1 if tsExpression is greater than or equal to lower and less than or equal to upper. Otherwise, returns 0. This function outputs continuous time series.
Parameters
| Property | Description |
|---|---|
| tsExpression | Expression that describes the time series to compare against an upper and lower limit. |
| lower | Lower bound for the between() function. |
| upper | Upper bound for the between() function. |
Description
The between() function determines whether the value of tsExpression is greater than or equal tolower and less than or equal to upper. When the value of tsExpression falls in between the values of lower and upper, the function displays 1 on the chart. When tsExpression does not fall between lower and upper, the function displays 0 on the chart. The values for tsExpression, lower, and upper can be any constant or time-series expression.
Examples
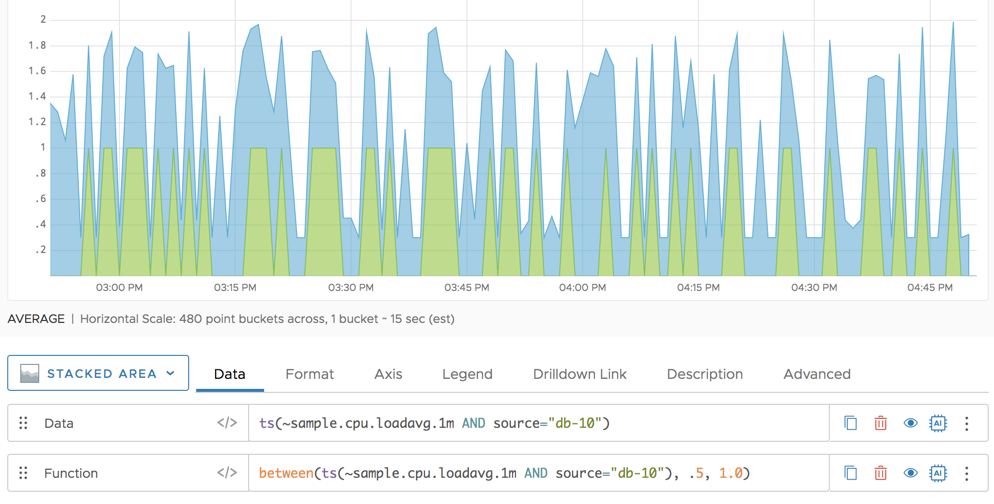
The following example screenshot of a Stacked Area chart shows the CPU load average per 1 minute.

The second screenshot shows the result of wrapping the function in between() in green. The value is 1 where the metric is between .5 and 1.0, and the value is zero otherwise.
