Summary
at(<atTime>, [lookbackWindow,] <tsExpression>)
Returns a single current or past reported data value from the time series described by the expression. The returned value is displayed continuously across the chart, so you can use it as a reference value for comparing against the results of other queries.
Parameters
| Parameter | Description |
|---|---|
| atTime | The report time of the data value to be returned, expressed as:
|
| lookbackWindow | The period of time before atTime in which to look for a data value to return, if no data is reported at atTime. You can specify a time window based on the clock or calendar (1s, 1m, 1h, 1d, 1w), or the window length (1vw) of the chart.
Default is 1h if lookbackWindow is not specified.
|
| tsExpression | Expression that describes the time series to return a data value from. |
Description
The at() standard time function returns the data value that was reported at a particular time by the time series described by the expression. The returned value is displayed continuously across the chart, so you can use it as a reference value for comparing against the results of other queries. at() returns a separate result for each time series described by the expression.
You designate the data value of interest by specifying the time it was reported. You can specify the report time in any of the following ways:
-
As an interval before the current time. For example, you can specify
2hto obtain the data value that was reported 2 hours ago. In fact, you’ll see the value from 2 hours ago, even if you’re looking at a chart of past values from weeks or months ago. -
As a time relative to your chart. For example, you can use
"start"to obtain the data value that was reported at the first time shown on your current chart. If you’re looking at a chart of past values,"start"causesat()to return the earliest of those past values. -
As the current time (
"now").
Live Data Updates
When live data is reported, at() adjusts the returned value as necessary to reflect any changes in the data reported by the time series. Adjustments can occur whenever the chart is updated (every 30 seconds in most cases). For example, consider a time series that reports a different value every 2 minutes. If you run a query with at() at 8:00am to return the value reported 2 hours ago (at 6:00am), the result is automatically adjusted around 8:02am to show the value that was reported at 6:02am.
Lookback Period
If no data value corresponds to the specified report time, at() returns the last data value that was reported during a lookback period just before the report time. By default, the lookback period is 1 hour. For example, suppose you run the query at(2h, ts(my.metric)) at 8:00am, but my.metric did not report a data value at 6:00am. The query returns the last data value that was reported between 5:00am and 6:00am. If no data was reported during that period, the query returns no data.
You can include a lookbackWindow parameter to specify a longer or shorter lookback period. For example:
- The query
at(2h, 8h, ts(my.metric))returns the last value to be reported during the 8-hour period from 10 hours ago to 2 hours ago. - The query
at("end", 30s, ts(my.metric))returns a data value if one was reported at the end of your current chart. Otherwise, the query returns no data, unless a value was reported within 30 seconds of the end of the chart.
Examples
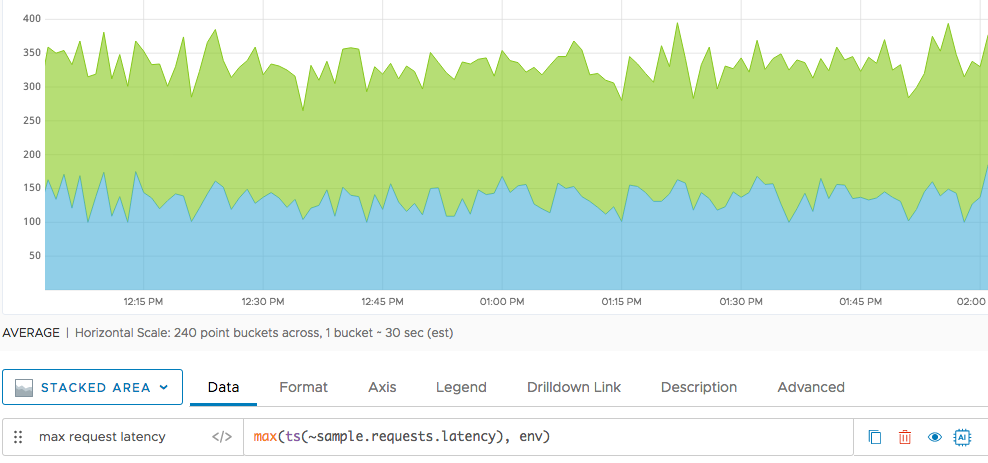
Here’s a query that shows the maximum request latency across all sources and point tags. We show a stacked area for each of the environments (env tag).

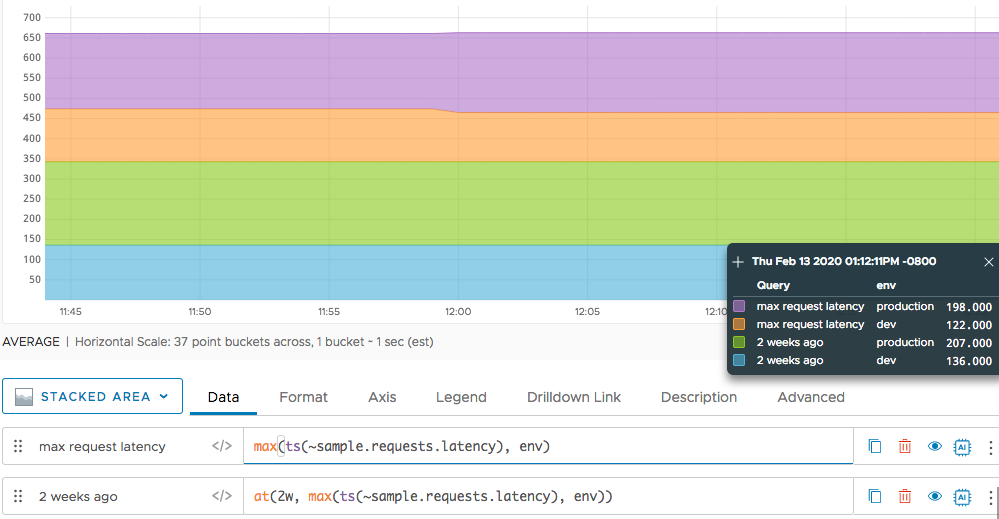
Now we’d like to see how these maximums compare to the maximum request latency that was reported 2 weeks ago. We add a second query that applies at() to the original query. From this chart, we can see some increases in the maximum latency over 2 weeks ago.

Caveats
Applying at() to the results of integral() may produce unexpected results because integral() considers time window boundaries inclusive. Use the msum() function with a 1vw time window argument instead.