Configure your OpenTracing Java application to send data using the Wavefront OpenTracing Java SDK.
In this tutorial, you configure a sample application with the Wavefront OpenTracing Java SDK. The application will send data to Tanzu Observability by Wavefront. Let’s get started!
Prerequisites
- Java 8 or later.
- Install the Docker platform. You’ll later run the Wavefront proxy on Docker.
- Clone the sample application. Open the command prompt and run the following command:
git clone https://github.com/wavefrontHQ/distributed-tracing-sample-apps.gitThis repository has many sample applications. Navigate to the dropwizard-app application.
cd distributed-tracing-sample-apps/Wavefront-DT/dropwizard-app/
Instrument the Sample Applications
- Open
dropwizard-appin your preferred Java IDE. - Add the Wavefront OpenTracing SDK dependency to the
pom.xmlfile and import the changes to your application:<dependencies> <dependency> <groupId>com.wavefront</groupId> <artifactId>wavefront-opentracing-sdk-java</artifactId> <version>LATEST</version> </dependency> </dependencies> - Configure the application to send data to the Wavefront service via the Wavefront proxy.
- For this tutorial, let’s install the Wavefront proxy on Docker.
See Install a Proxy to find other options for installing the proxy on your environment.docker run -d \ -e WAVEFRONT_URL=<your_cluster_name> \ -e WAVEFRONT_TOKEN=<your_token> \ -e JAVA_HEAP_USAGE=512m \ -p 2878:2878 \ wavefronthq/proxy:latestNote: Replace<your_cluster_name>and<your_token>with the name of your Wavefront instance and API token.Tip: If you are not sure of your cluster name or token, log in to your Wavefront instance, click Browse > Proxies > Add New Proxy, and click the Docker tab. Copy the command on the tab and run it. - Open the
common/src/main/java/com/wfsample/common/Tracing.javafile and update the following:- Make sure the following dependencies are set.
import com.wavefront.opentracing.WavefrontTracer; import com.wavefront.opentracing.reporting.Reporter; import com.wavefront.opentracing.reporting.WavefrontSpanReporter; import com.wavefront.sdk.common.WavefrontSender; import com.wavefront.sdk.common.application.ApplicationTags; import com.wavefront.sdk.common.clients.WavefrontClientFactory; - Change the
Tracer init(String service)method to return a WavefrontTracer. - Assign a name for the application. This will later help you identify the application and view the data that was sent. For this example, let’s use
foo-beachshirtsor use a name you like.
Your code looks as follows:
public static Tracer init(String service) { WavefrontClientFactory wavefrontClientFactory = new WavefrontClientFactory(); wavefrontClientFactory.addClient("http://localhost:2878/"); WavefrontSender wavefrontSender = wavefrontClientFactory.getClient(); String applicationName = "foo-beachshirts"; ApplicationTags applicationTags = new ApplicationTags.Builder(applicationName, service).build(); Reporter wfSpanReporter = new WavefrontSpanReporter.Builder(). build(wavefrontSender); WavefrontTracer.Builder wfTracerBuilder = new WavefrontTracer. Builder(wfSpanReporter, applicationTags); wfTracerBuilder.redMetricsCustomTagKeys(new HashSet<String>(Arrays.asList("env"))); return wfTracerBuilder.build(); } - Make sure the following dependencies are set.
- For this tutorial, let’s install the Wavefront proxy on Docker.
- Run
mvn clean installfrom the root directory of the project. - Start the
shopping,styling, anddeliveryservices by running the following commands from the root directory of the project.Note: Run each command on a separate terminal.java -jar ./shopping/target/shopping-1.0-SNAPSHOT.jar server ./shopping/app.yaml java -jar ./styling/target/styling-1.0-SNAPSHOT.jar server ./styling/app.yaml java -jar ./delivery/target/delivery-1.0-SNAPSHOT.jar server ./delivery/app.yaml - Run the
./loadgen.shscript on a new terminal. The script will order a shirt and call the shop, style, and deliver services. Let’s run it every 5 seconds../loadgen.sh 5
View Data in the Application Map
You use the Application Map and related pages to visualize the trace data that you collect from your instrumented application.
- Click Applications > Application Status to get an overview of the services and applications.
- Application Map gives you an overview of how the applications and services are linked, lets you focus on a specific service, view Request, Error, and Duration (RED) metrics for each service, and the tracing traffic in the application.
- Table View gives you a list of the applications and services. You can see the Request, Error, and Duration (RED) metrics at a glance and sort the data.
- Grid view lists the application and services in a grid. You can see the RED metrics for each of the application’s services.

- Click the Application Map icon (
 ), click the settings icon, and select Error or Duration to update the legend.
These settings can be configured by each user and apply to the table view and grid view too.
- Click the settings icon and select an option from the Service Layout dropdown.
View the services in the default, concentric, circle, or grid layout. Choose the layout that helps you understand how your services are linked.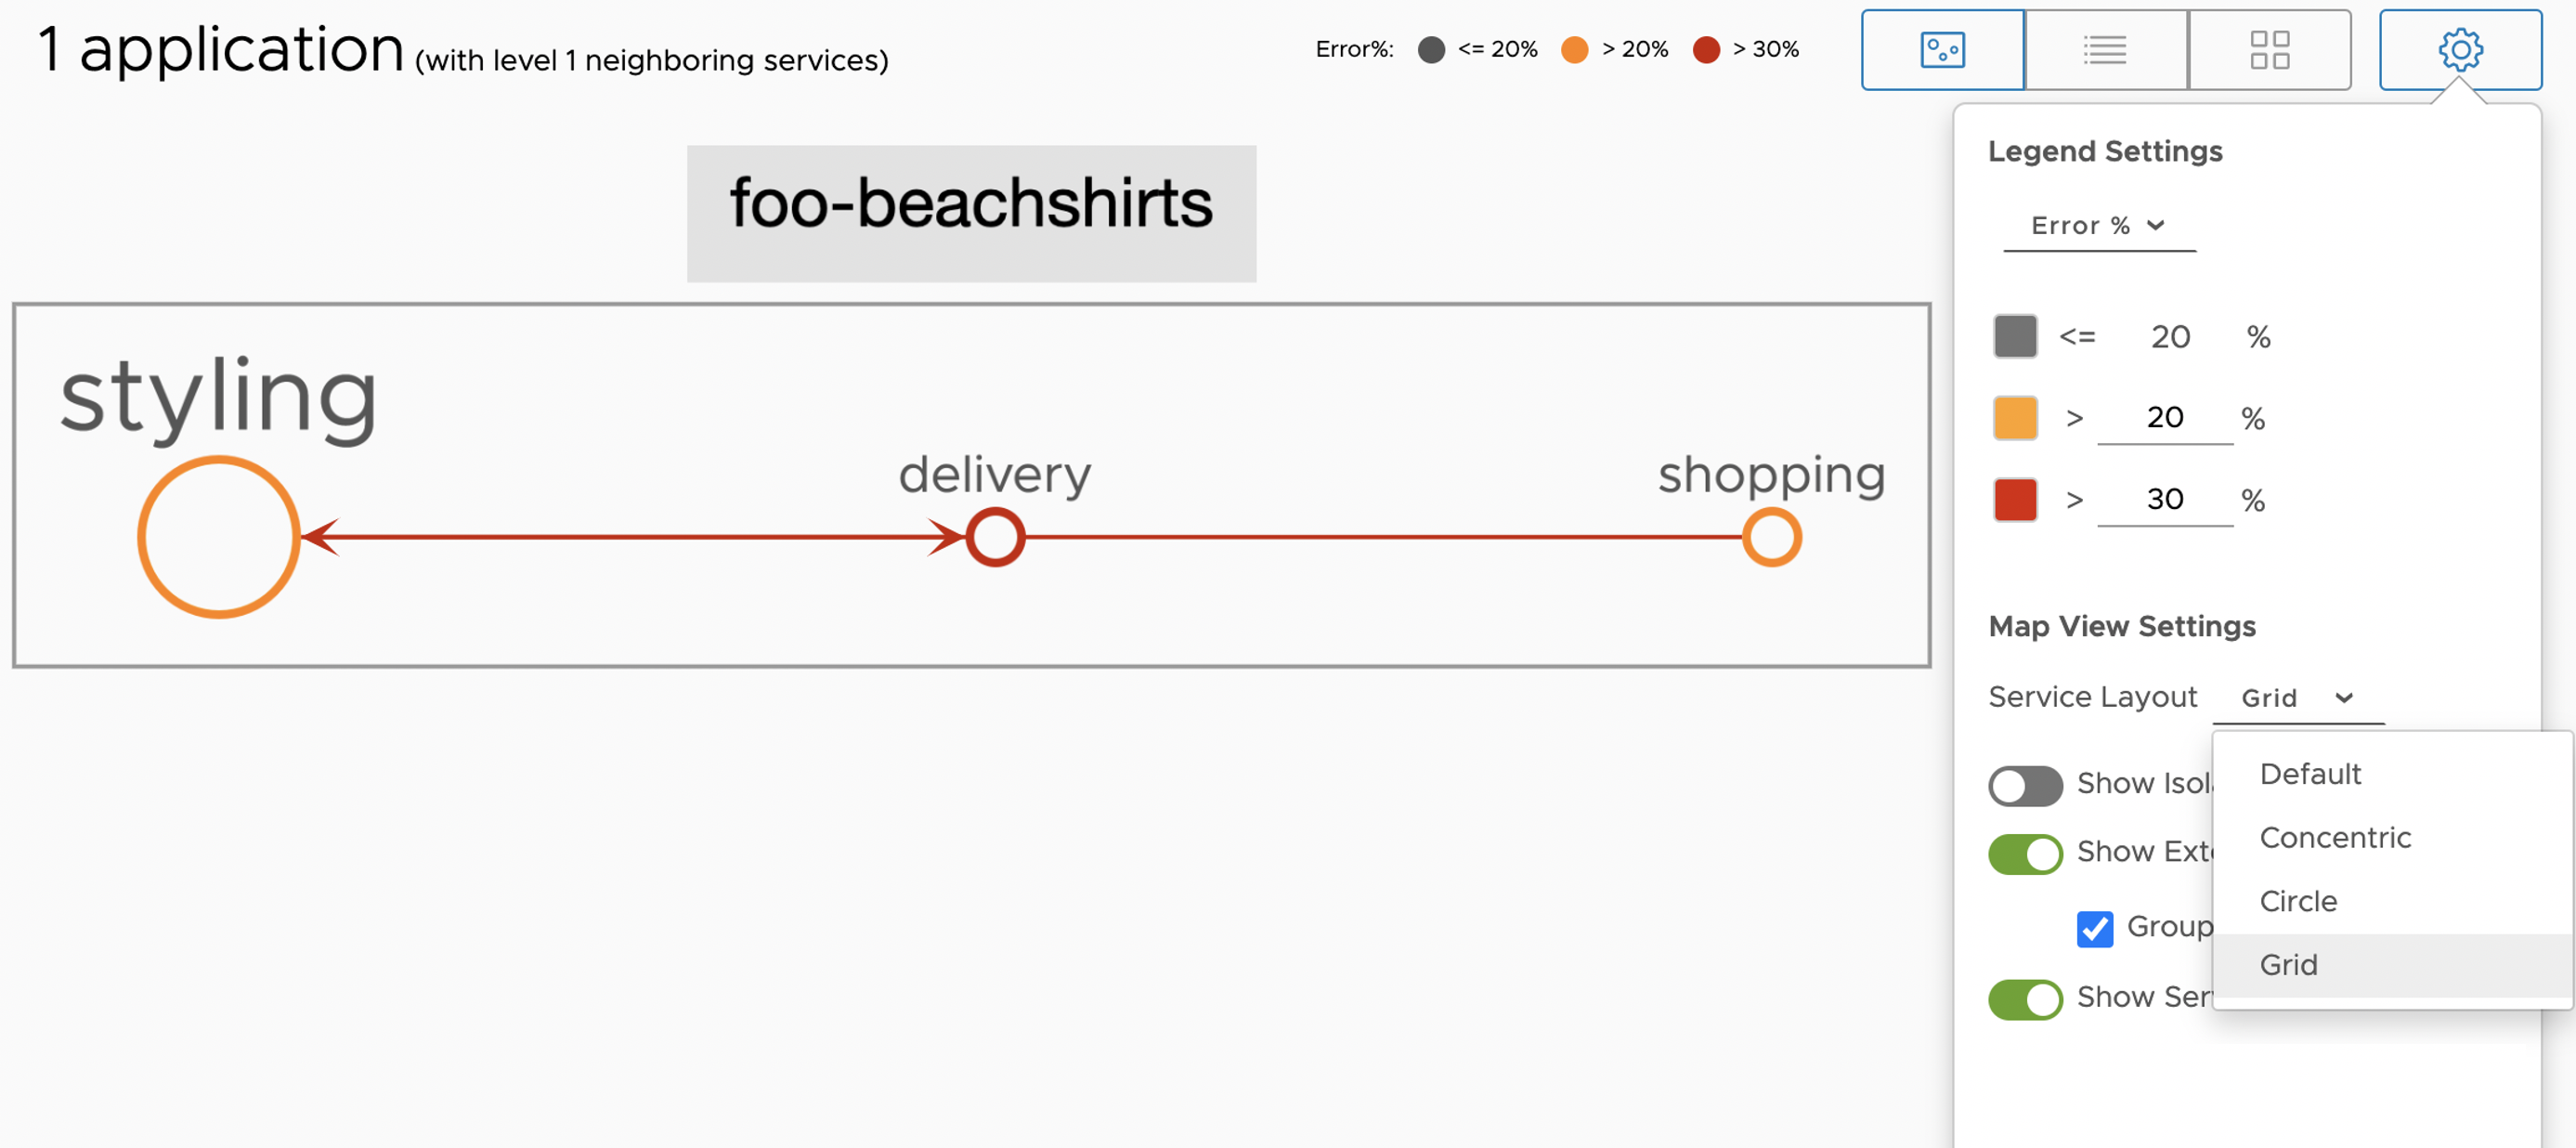
- Click on the styling service and click Dashboard.
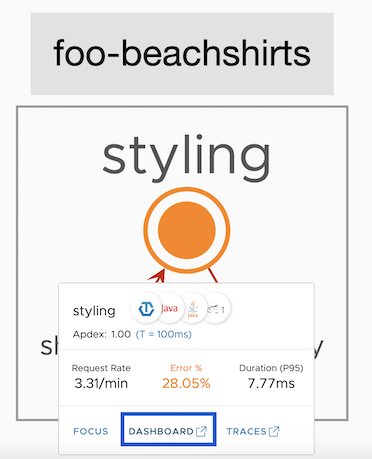
- You are taken to the Service Dashboard of the styling service. The default, read-only dashboard for a service lets you explore:
- RED metrics derived from trace data.
- Component metrics data sent by each service in your application.
- Click See All styling Traces.

- You are taken to the Traces Browser, which supports a streamlined task flow for examining traces. You can perform trace queries, view query results, expand traces to see their member spans, and expand individual spans to see their details without having to navigate between pages and pop-ups.
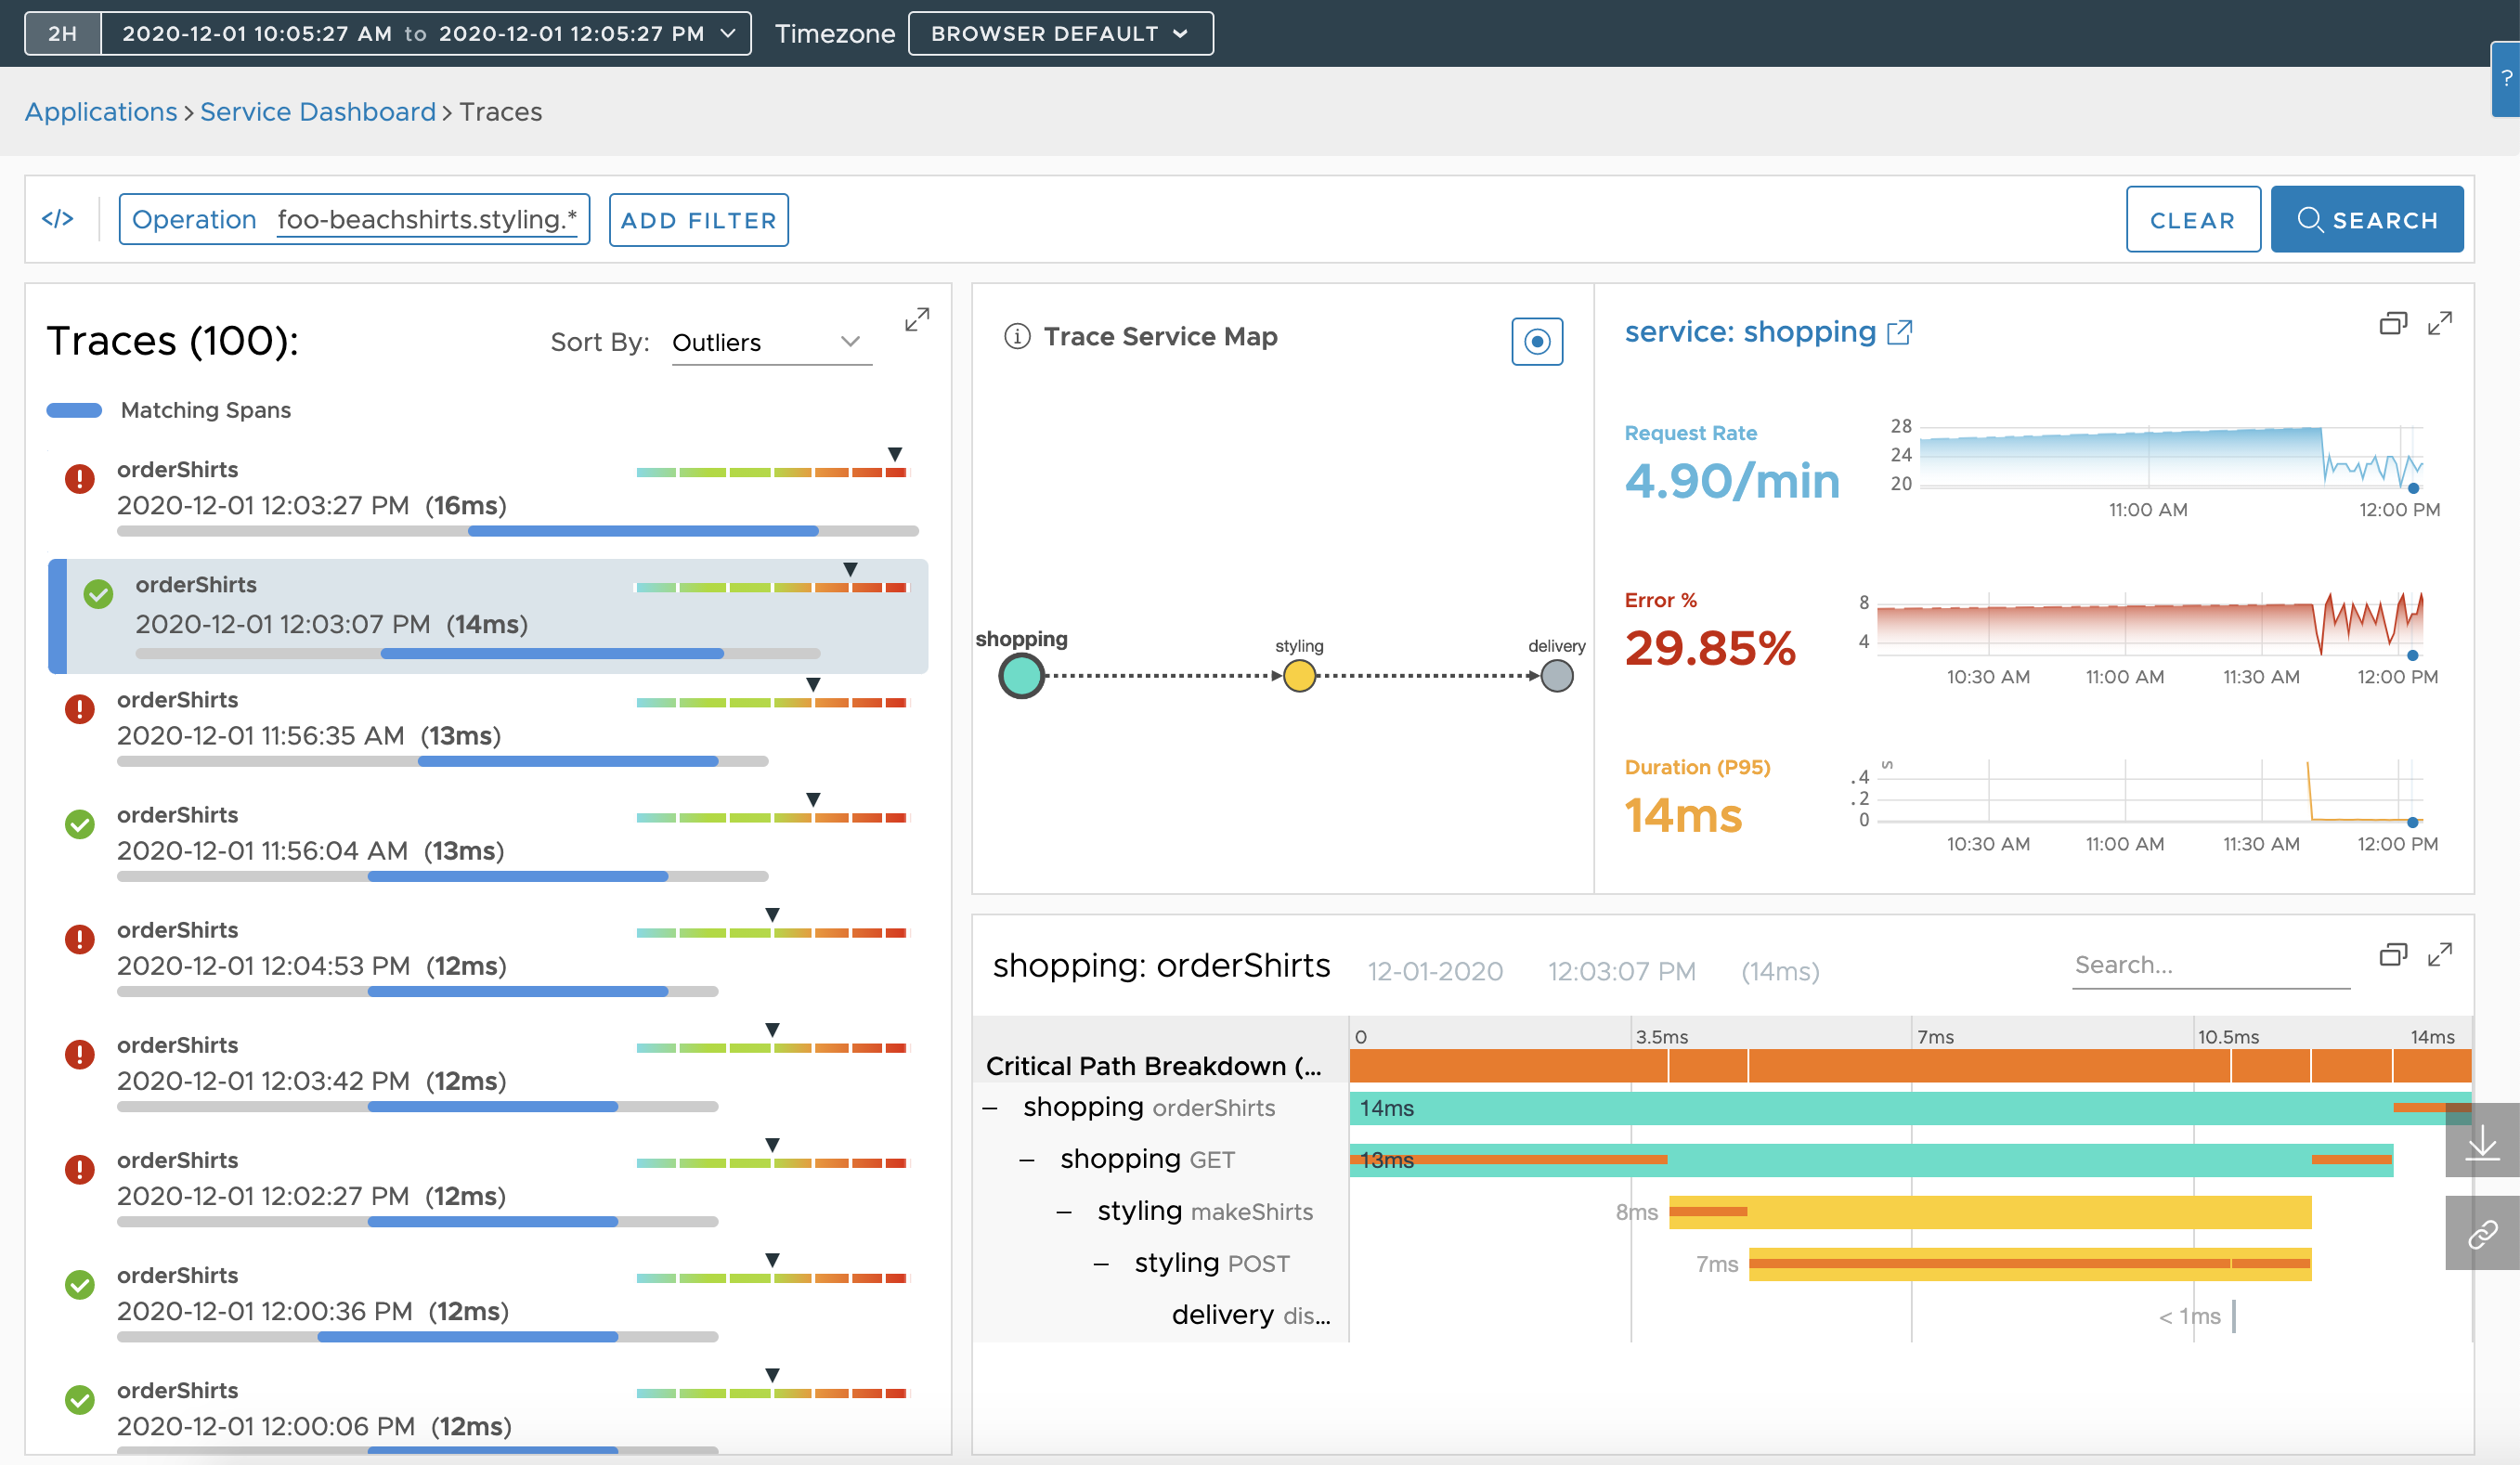
- Optionally, you can download the traces, and view them later using Offline Traces.
Next Steps
- Learn how to instrument your application and view data on the Application Map and related pages.
- Familiarize yourself with the tracing concepts. See Tracing Concepts in Tanzu Observability for details.