This page provides an overview of what you can do with the tcServer integration. The documentation pages only for a limited number of integrations contain the setup steps and instructions. If you do not see the setup steps here, navigate to the Operations for Applications GUI. The detailed instructions for setting up and configuring all integrations, including the tcServer integration are on the Setup tab of the integration.
- Log in to your Operations for Applications instance.
- Click Integrations on the toolbar, search for and click the tcServer tile.
- Click the Setup tab and you will see the most recent and up-to-date instructions.
Apache Tomcat Integration
The Apache Tomcat® software is an open source implementation of the Java Servlet, JavaServer Pages, Java Expression Language and Java WebSocket technologies.
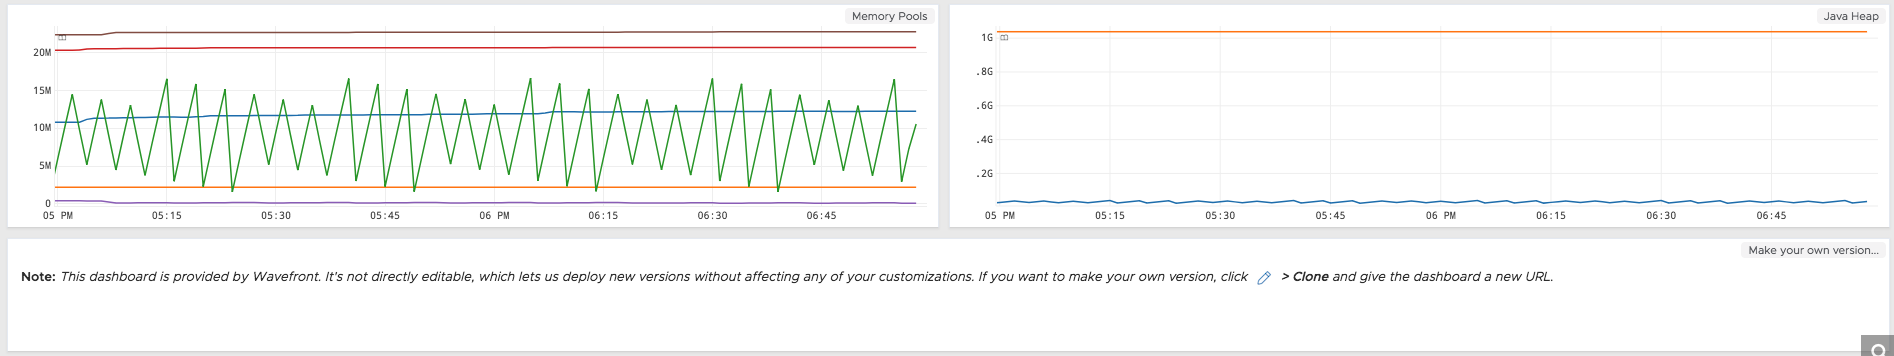
In addition to setting up the metrics flow, this integration also sets up a dashboard.

Metrics
Information about server activity and performance. Metrics descriptions are collected from the mod_status Apache Module.
| Metric Name | Description |
|---|---|
| apache.BusyWorkers | Number of workers that are serving requests. |
| apache.BytesPerReq | Number of bytes per request. |
| apache.BytesPerSec | Number of bytes transferred per second. |
| apache.CPUChildrenSystem | Jiffs used in User Mode by child processes. |
| apache.CPUChildrenUser | Jiffs used in System Mode by child processes. |
| apache.CPULoad | CPU load of your HTTP server. |
| apache.CPUSystem | CPU processes in System mode. |
| apache.CPUUser | CPU used by the user process. |
| apache.ConnsAsyncClosing | Number of asynchronous connections that are closing. |
| apache.ConnsAsyncKeepAlive | Number of asynchronous connections that are kept alive. |
| apache.ConnsAsyncWriting | Number of asynchronous connections that are writing. |
| apache.ConnsTotal | Total number of connections served by Apache. |
| apache.IdleWorkers | Number of workers that are idling. |
| apache.Load1 | Server load over last 1 minute. |
| apache.Load15 | Server load over last 15 minutes. |
| apache.Load5 | Server load over last 5 minutes. |
| apache.ParentServerConfigGeneration | Number of times the Apache server reread config and restarted child processes. |
| apache.ParentServerMPMGeneration | Number of times the Apache server reread the MPG config and restarted child processes. |
| apache.ReqPerSec | Number of requests per second. |
| apache.ServerUptimeSeconds | Server uptime (in seconds). |
| apache.TotalAccesses | Total number of accesses. |
| apache.TotalkBytes | Number of kilobytes served. |
| apache.Uptime | Total uptime of the server. |
| apache.accesses.total.counter | Total number of times this server was accessed. |
| apache.cpuload.gauge | CPU load for this server. |
| apache.exporter.build.info.gauge | Apache exporter build information. |
| apache.scboard.closing | Number of worker threads that are closing a TCP connection (after serving a response). |
| apache.scboard.dnslookup | Number of worker threads currently performing a DNS lookup. |
| apache.scboard.finishing | Number of worker threads finishing (part of server shutdown). |
| apache.scboard.idle.cleanup | Number of idle worker threads that are ready for cleanup. |
| apache.scboard.keepalive | Number of worker threads that keep the connection alive (expecting another request on the same connection). |
| apache.scboard.logging | Number of worker threads writing to the log file. |
| apache.scboard.open | Number of open worker slots. |
| apache.scboard.reading | Number of workers receiving requests. |
| apache.scboard.sending | Number of workers sending responses. |
| apache.scboard.starting | Number of workers in the process of starting. |
| apache.scboard.waiting | Number of workers waiting for incoming requests. |
| apache.scoreboard.gauge | Scoreboard gauge. |
| apache.sent.kilobytes.total.counter | Total number of kilobytes sent. |
| apache.up.gauge | Shows whether server could be reached. |
| apache.uptime.seconds.total.counter | Total uptime, in seconds. |
| apache.workers.gauge | Apache worker status. |