This page provides an overview of what you can do with the Python integration. The documentation pages only for a limited number of integrations contain the setup steps and instructions. If you do not see the setup steps here, navigate to the Operations for Applications GUI. The detailed instructions for setting up and configuring all integrations, including the Python integration are on the Setup tab of the integration.
- Log in to your Operations for Applications instance.
- Click Integrations on the toolbar, search for and click the Python tile.
- Click the Setup tab and you will see the most recent and up-to-date instructions.
Python Integration
This Wavefront Python integration explains how to send Python application metrics to Tanzu Observability.
Tanzu Observability provides several Python SDKs and a REST API client for different purposes on Github:
- wavefront-sdk-python: Core SDK for sending different telemetry data to Tanzu Observability. Data include metrics, delta counters, distributions, and spans.
- wavefront-pyformance: Provides reporters and constructs such as counters, meters and histograms to periodically report application metrics and distributions to Tanzu Observability.
- wavefront-lambda-python: Wavefront Python wrapper for AWS Lambda to enable reporting of standard lambda metrics and custom app metrics directly to Tanzu Observability.
- wavefront-opentracing-sdk-python: Wavefront OpenTracing Python SDK. See our tracing documentation for background.
- python-client: The Wavefront REST API client enables you to interact with Wavefront servers using the standard REST API. You can use this client to automate commonly executed operations such as automatically tagging sources.
In the Setup tab, the integration includes sample code based on wavefront-pyformance for sending metrics to a Wavefront proxy or using direct ingestion.
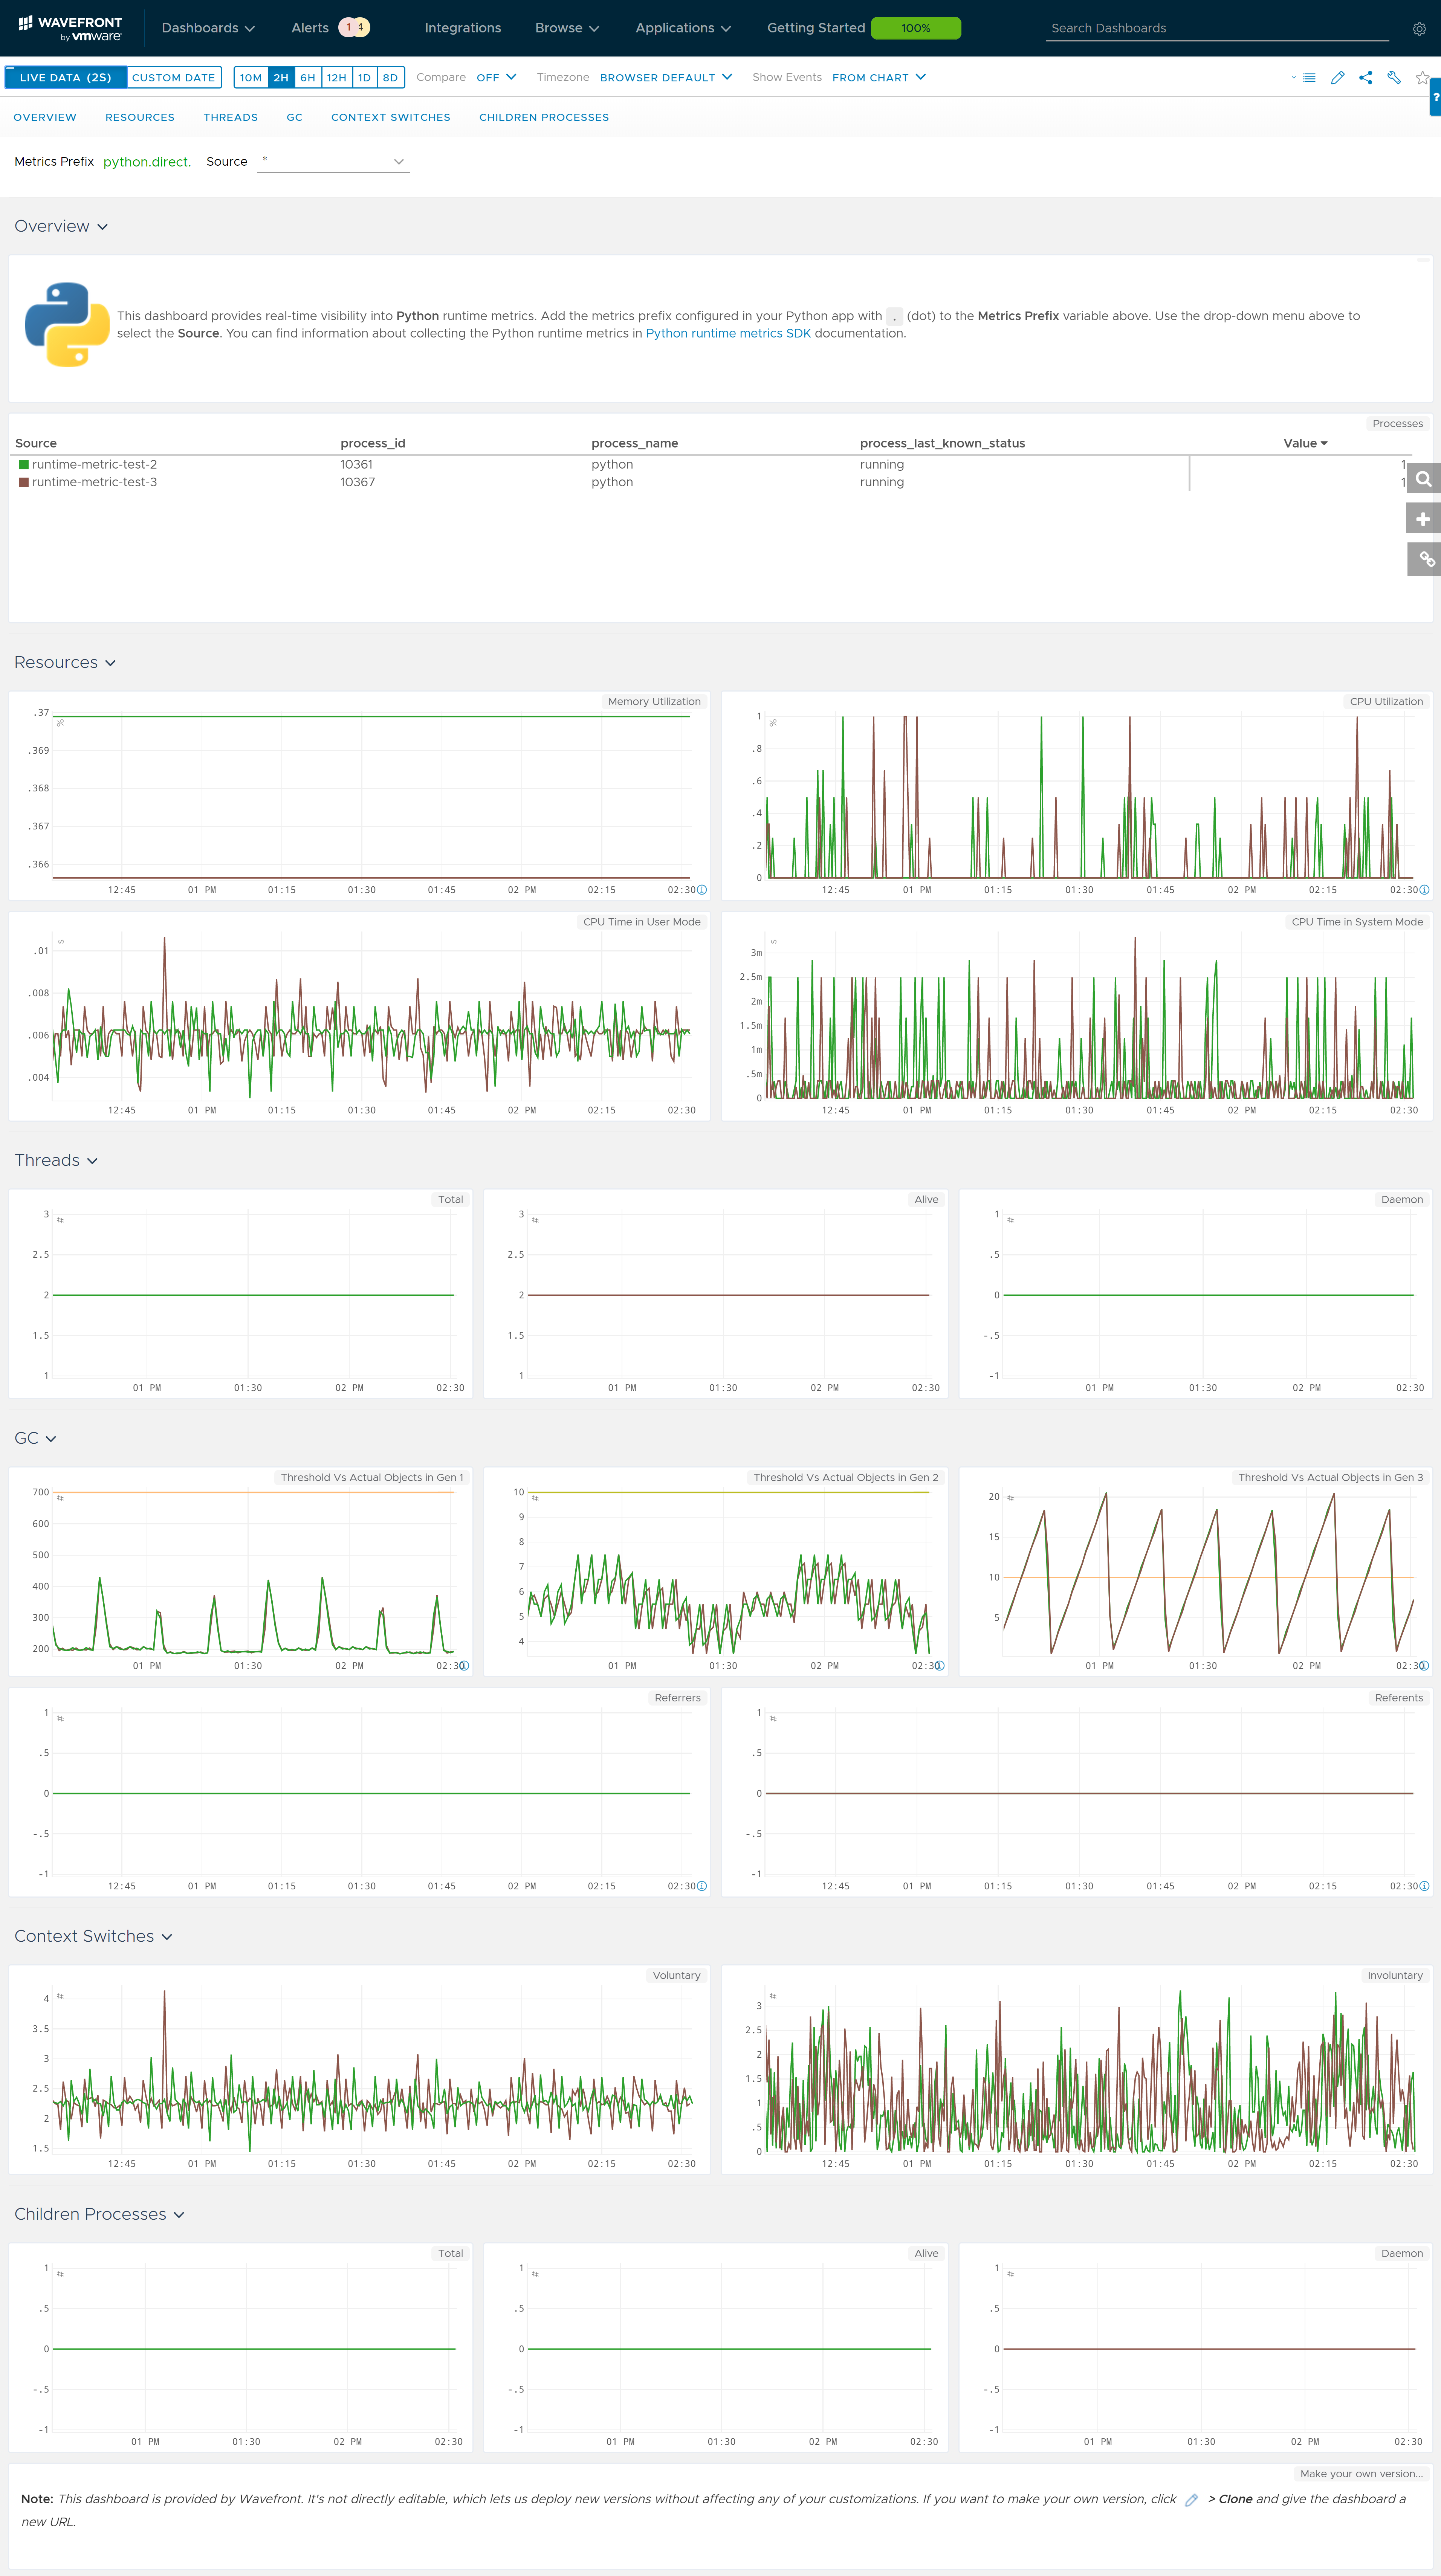
In the Dashboard tab, you can view the dashboard around Python runtime metrics that can be collected using wavefront-pyformance. You can also send your own metrics and create your own dashboards.
Here’s a preview of some charts in Python Runtime dashboard:
