This page provides an overview of what you can do with the IIS integration. The documentation pages only for a limited number of integrations contain the setup steps and instructions. If you do not see the setup steps here, navigate to the Operations for Applications GUI. The detailed instructions for setting up and configuring all integrations, including the IIS integration are on the Setup tab of the integration.
- Log in to your Operations for Applications instance.
- Click Integrations on the toolbar, search for and click the IIS tile.
- Click the Setup tab and you will see the most recent and up-to-date instructions.
IIS Integration
Internet Information Services (IIS) for Windows® Server is a flexible, secure and manageable Web server for internet hosting. This integration installs and configures Telegraf to send IIS metrics into Tanzu Observability. Telegraf is a light-weight server process capable of collecting, processing, aggregating, and sending metrics to a Wavefront proxy.
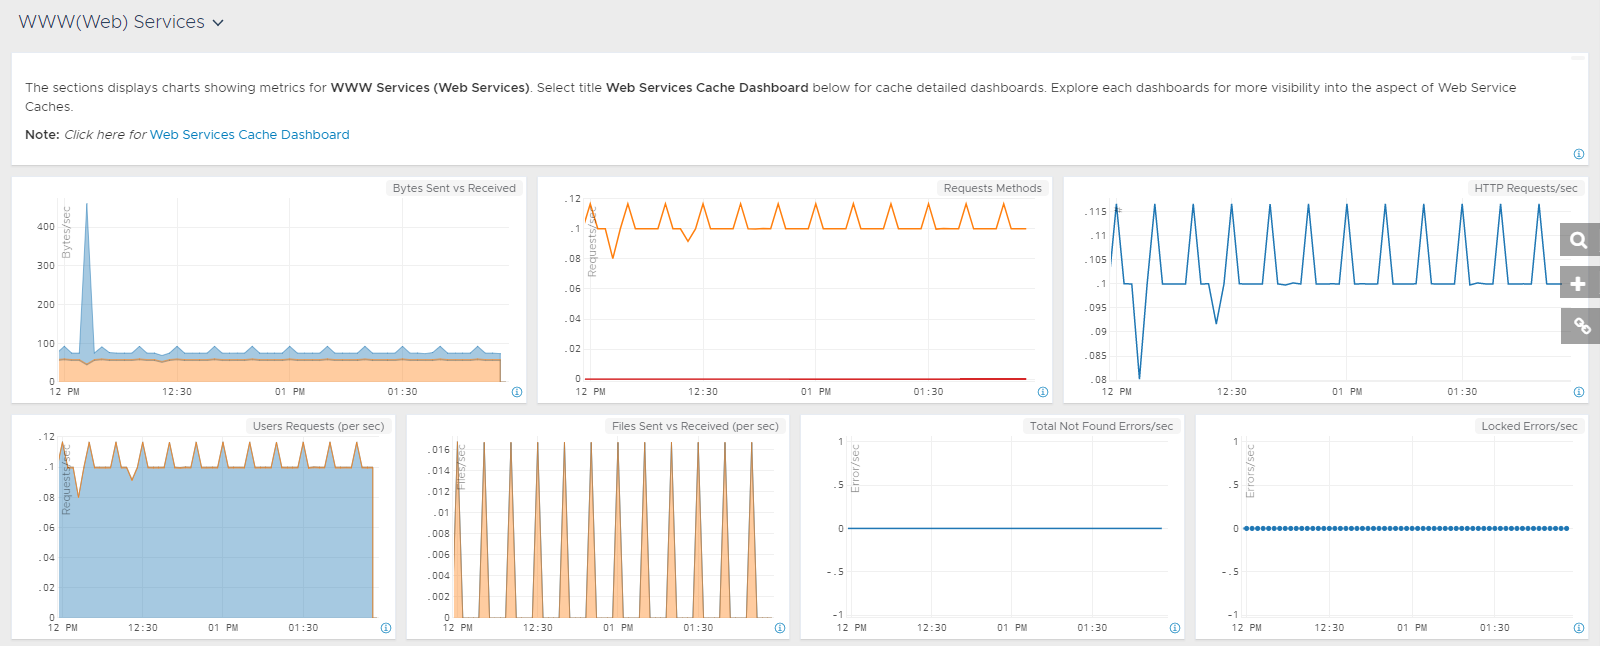
In addition to setting up the metrics flow, this integration also installs a dashboard. Here’s the WWW(Web) Services section of a dashboard displaying IIS metrics:
Metrics
| Metric Name | Description |
|---|---|
| iis.aspnet.Application.Restarts | Application restarts by IIS ASP.NET. |
| iis.aspnet.Requests.Queued | Queued requests. |
| iis.aspnet.Requests.Rejected | Rejected requests. |
| iis.aspnet.app.Cache.* | Application cache metrics. The caching classes in the System.Runtime.Caching namespace provide functionality for caching data in ASP.NET. |
| iis.aspnet.app.Cache.Total.Entries | |
| iis.aspnet.app.Cache.Total.Hit.Ratio | |
| iis.aspnet.app.Cache.Total.Hits | |
| iis.aspnet.app.Cache.Total.Misses | |
| iis.aspnet.app.Cache.Total.Turnover.Rate | |
| iis.aspnet.app.Errors.Total | Total ASP.NET application errors. |
| iis.aspnet.app.Pipeline.Instance.Count | Instance count for the application pipeline. |
| iis.aspnet.app.Requests.persec | ASP.NET application requests per seconds. |
| iis.dotnet.exception.-.of.Exceps.Thrown | Metrics for IIS .NET exceptions |
| iis.dotnet.exception.-.of.Exceps.Thrown | |
| iis.dotnet.exception.-.of.Exceps.Thrown.-.Sec | |
| iis.dotnet.exception.-.of.Filters.-.Sec | |
| iis.dotnet.exception.-.of.Finallys.-.Sec | |
| iis.dotnet.exception.Throw.to.Catch.Depth.-.Sec | |
| iis.http.queues.* | Metrics related to IIS HTTP queues. |
| iis.http.queues.CurrentQueueSize | |
| iis.http.queues.RejectedRequests | |
| iis.websvc.Anonymous.* | IIS web server metrics. |
| iis.websvc.Anonymous.Users.persec | |
| iis.websvc.Bytes.Received.persec | |
| iis.websvc.Bytes.Sent.persec | |
| iis.websvc.Bytes.Total.persec | |
| iis.websvc.Current.Connections | |
| iis.websvc.Delete.Requests.persec | |
| iis.websvc.Files.Received.persec | |
| iis.websvc.Files.Sent.persec | |
| iis.websvc.Files.persec | |
| iis.websvc.Get.Requests.persec | |
| iis.websvc.Locked.Errors.persec | |
| iis.websvc.NonAnonymous.Users.persec | |
| iis.websvc.Not.Found.Errors.persec | |
| iis.websvc.Post.Requests.persec | |
| iis.websvc.Put.Requests.persec | |
| iis.websvc.Service.Uptime | |
| iis.websvc.Total.Bytes.Received | |
| iis.websvc.Total.Bytes.Sent | |
| iis.websvc.Total.Bytes.Transferred | |
| iis.websvc.Total.Delete.Requests | |
| iis.websvc.Total.Files.Received | |
| iis.websvc.Total.Files.Sent | |
| iis.websvc.Total.Files.Transferred | |
| iis.websvc.Total.Get.Requests | |
| iis.websvc.Total.Method.Requests.persec | |
| iis.websvc.Total.Post.Requests | |
| iis.websvc.Total.Put.Requests | |
| iis.websvc.cache.* | IIS web service cache metrics. |
| iis.websvc.cache.Active.Flushed.Entries | |
| iis.websvc.cache.Current.File.Cache.Memory.Usage | |
| iis.websvc.cache.Current.Files.Cached | |
| iis.websvc.cache.Current.Metadata.Cached | |
| iis.websvc.cache.Current.URIs.Cached | |
| iis.websvc.cache.File.Cache.Flushes | |
| iis.websvc.cache.File.Cache.Hits | |
| iis.websvc.cache.File.Cache.Hits.Percent | |
| iis.websvc.cache.File.Cache.Misses | |
| iis.websvc.cache.Kernel-.Current.URIs.Cached | |
| iis.websvc.cache.Kernel-.Total.Flushed.URIs | |
| iis.websvc.cache.Kernel-.Total.URIs.Cached | |
| iis.websvc.cache.Kernel-.URI.Cache.Flushes | |
| iis.websvc.cache.Kernel-.URI.Cache.Hits | |
| iis.websvc.cache.Kernel-.URI.Cache.Hits.Percent | |
| iis.websvc.cache.Kernel-.URI.Cache.Misses | |
| iis.websvc.cache.Kernel-.Uri.Cache.Hits.persec | |
| iis.websvc.cache.Maximum.File.Cache.Memory.Usage | |
| iis.websvc.cache.Metadata.Cache.Flushes | |
| iis.websvc.cache.Metadata.Cache.Hits | |
| iis.websvc.cache.Metadata.Cache.Hits.Percent | |
| iis.websvc.cache.Metadata.Cache.Misses | |
| iis.websvc.cache.Total.Files.Cached | |
| iis.websvc.cache.Total.Flushed.Files | |
| iis.websvc.cache.Total.Flushed.Metadata | |
| iis.websvc.cache.Total.Flushed.URIs | |
| iis.websvc.cache.Total.Metadata.Cached | |
| iis.websvc.cache.Total.URIs.Cached | |
| iis.websvc.cache.URI.Cache.Flushes | |
| iis.websvc.cache.URI.Cache.Hits | |
| iis.websvc.cache.URI.Cache.Hits.Percent | |
| iis.websvc.cache.URI.Cache.Misses |