Summary
summary(<percentageList>, <hsExpression>)
Returns time series that summarize the significant values from the histogram distributions described by the expression. The summary includes a time series for each percentage percentile.
Parameters
| Parameter | Description |
|---|---|
| percentageList | Comma-separated list of percentages that specify the percentiles you want in your summary.
A percentile is the value below which a given percentage of values fall in a histogram distribution. Specify:
|
| hsExpression | Expression describing the histogram series to summarize. |
Description
The summary() histogram function summarizes significant values from the distributions in each histogram series described by the expression.
The summary for a histogram series consists of one or more time series that contain percentiles from each distribution in the series.
A percentile is a value below which a particular percentage of values fall. For example, summary(75, 99.99, hs(my.hsMetric.m)) returns values at the 75th and 99.99th percentiles from each distribution in the histogram series. The values are returned as two separate time series.
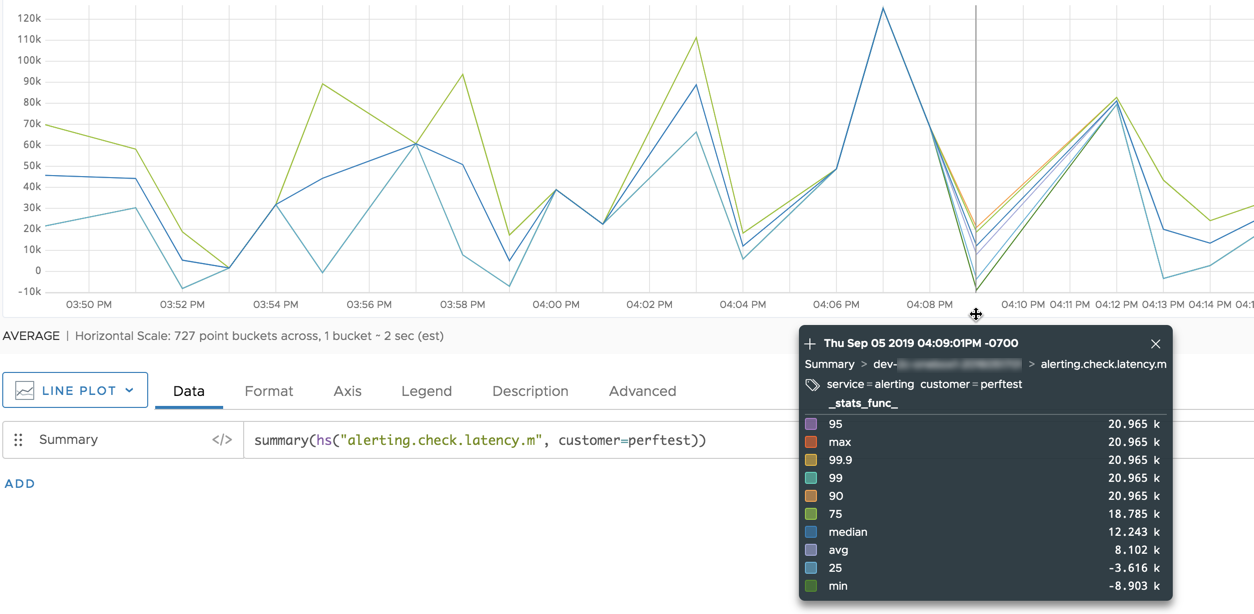
By default, summary() returns a time series for each the following: max, 99.9, 99, 95, 90, 75, avg, median (50), 25, and min.
Examples
This chart summarizes the default set of significant values from the histogram series that is described by the expression hs(alerting.check.latency.m, customer="perftest").
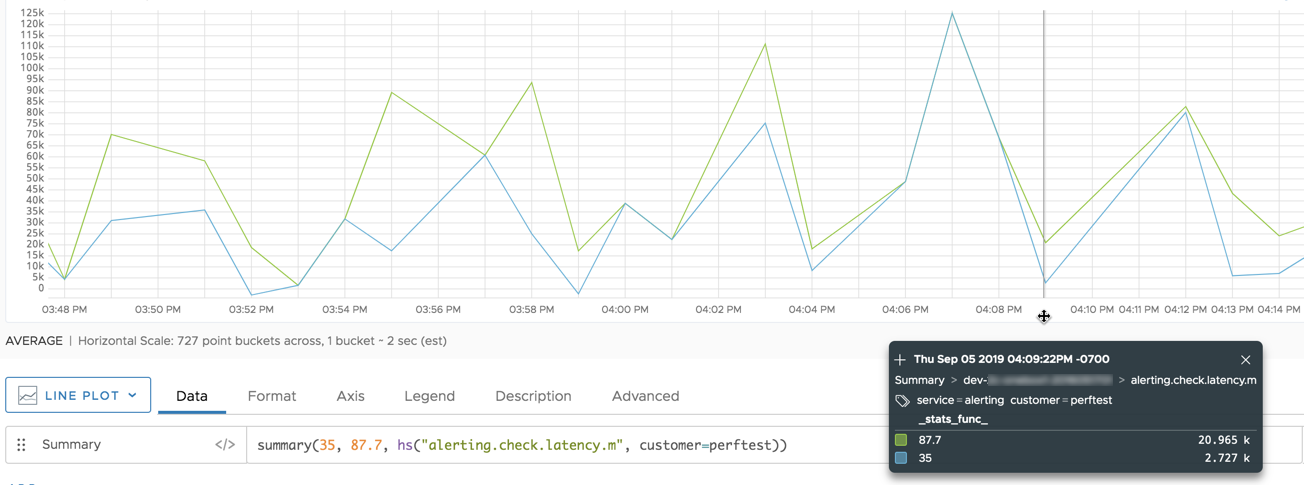
This chart summarizes just the 35th percentile and the 87.7th percentile from the histogram series.