Summary
stddev(<hsExpression>)
Shows how the data in a histogram expression is distributed around the mean.
Parameters
| Parameter | Description |
|---|---|
| hsExpression | Expression describing the histogram series. |
Description
The stddev() function shows you how the data in a histogram expression varies against the mean or average and returns those values as a time series. A separate time series is returned for each histogram series. You can use this function to understand the volatility of your data or to find anomalies in your histogram expression.
Example
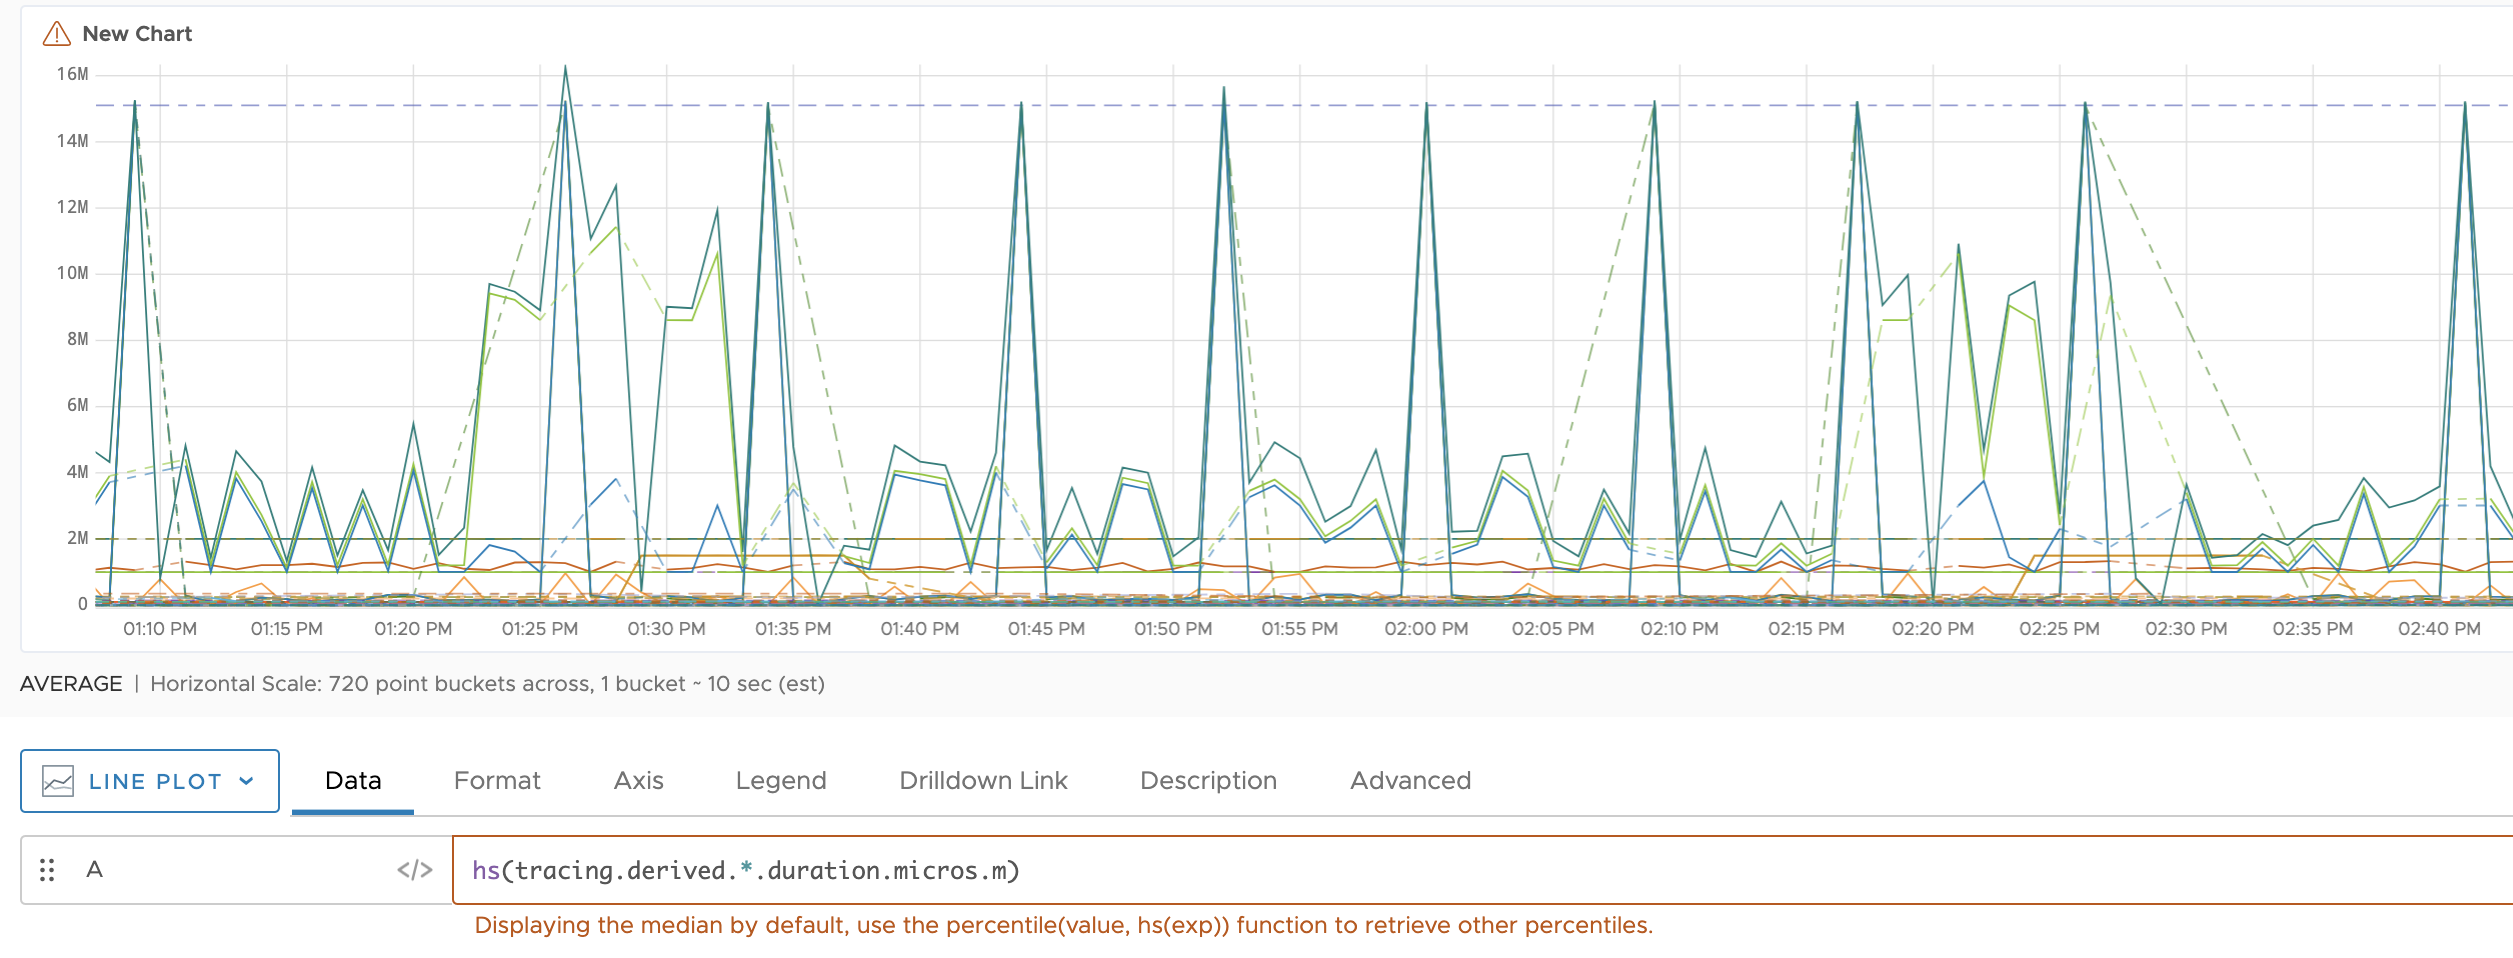
This chart represents all the histogram series described by hs(tracing.derived.*.duration.micros.m)). Each histogram series consists of distributions from a particular source, and a given source might emit more than one histogram series. The chart represents each histogram series as a separate line that shows the median values of the distributions.

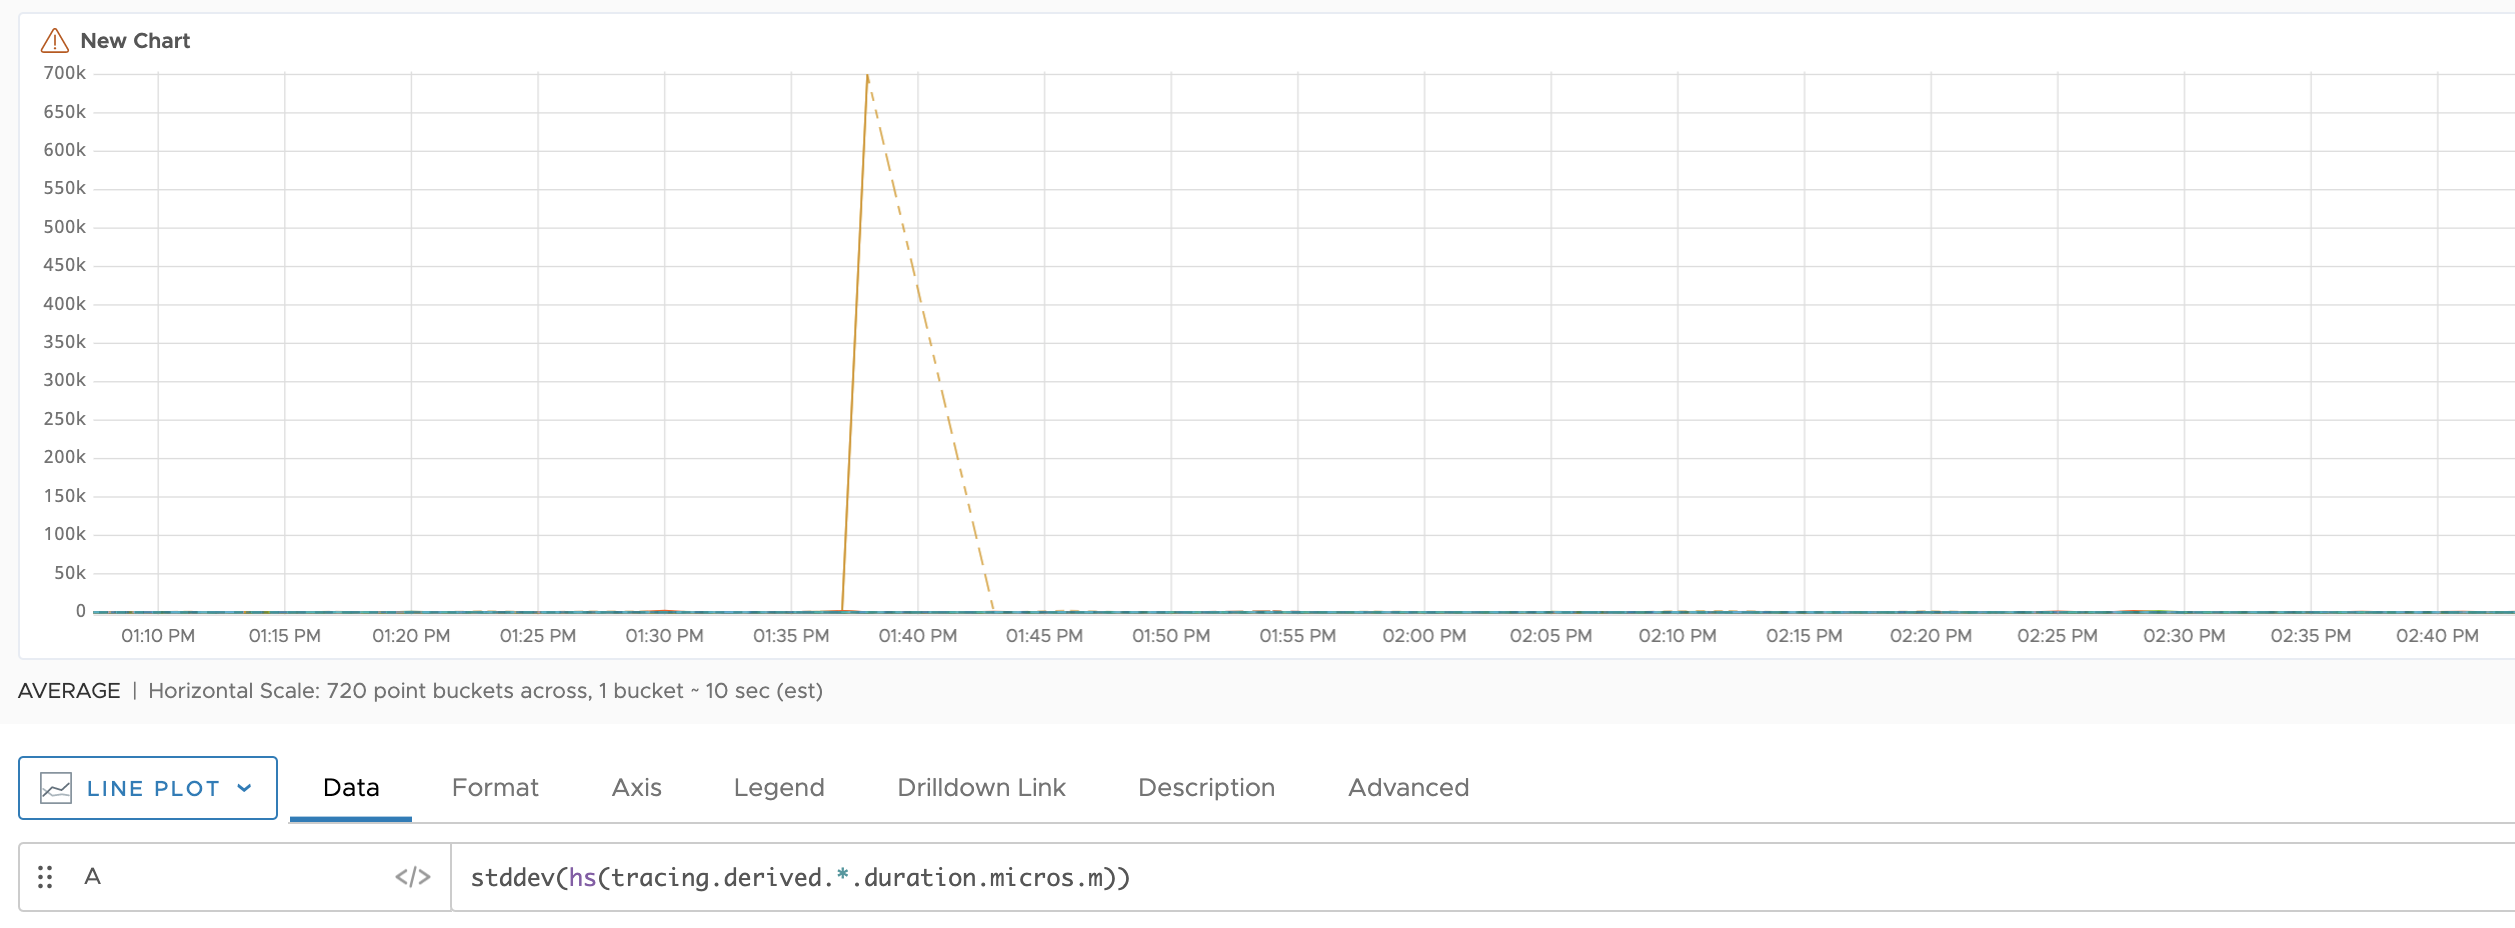
Use the following query to find the standard deviation:
stddev(hs(tracing.derived.*.duration.micros.m)))
Now, you see how the data in your expression varies against the mean. You see an anomaly (a spike) between 1.35 PM and 1.45 AM.
