Summary
merge(<hsExpression>[, metrics|sources|sourceTags|pointTags|<pointTagKey>])
Merges the series of histogram distributions described by the expression, and returns one or more series of composite histogram distributions. In a time-series chart, merge() displays just the median values of the composite distributions.
Parameters
| Parameter | Description |
|---|---|
| hsExpression | Expression describing the histogram series to be merged. |
| metrics|sources|sourceTags|pointTags|<pointTagKey> | Optional group by parameter for organizing the input histogram series into subgroups and then merging the series within each subgroup.
Use one or more parameters to group by metric names, source names, source tag names, point tag names, values for a particular point tag key, or any combination of these items. Specify point tag keys by name. |
Description
The merge() histogram function combines the histogram distributions at each histogram interval, across the histogram series that are represented by the expression. This function merges the centroids and counts across the histogram series to produce composite histogram distributions.
You typically use merge() as part of an input hsExpression that you specify to another histogram query function, for example, max(merge(hs(users.settings.numberOfApiTokens.m)))
You can visualize merge() by running it as a top-level query under a time-series chart. Doing so displays a time series that consists of just the median values from the distributions in each returned histogram series. The chart for merge(hs(my.hsMetric.m)) is the same as the chart for median(merge(hs(my.hsMetric.m))).
Grouping
merge() is an aggregation function for histogram series, and returns a single series by default. You can include a group by parameter to subdivide the results by merging subgroups of series that share common metric names, source names, source tags, point tags, or values for a particular point tag key.
The function returns a separate histogram series of results corresponding to each subgroup.
For example, merge(hs(users.settings.numberOfApiTokens.m), sources) returns a separate series of merged distributions for each source.
You can specify multiple ‘group by’ parameters to group the histogram series based on multiple characteristics. For example, merge(hs(users.settings.numberOfApiTokens.m), metrics, Customer) first groups by metric names, and then groups by the values of the Customer point tag.
zone and ZONE, when you use an aggregation function and apply grouping, we consider zone and ZONE as separate tags. Examples
Unmerged Histogram Series
This chart represents all of the histogram series described by the expression hs(alerting.check.latency.m). Each histogram series consists of distributions from a particular source, and a given source might emit more than one histogram series. The chart represents each histogram series as a separate line that consists of the median values of the distributions.
We will merge these series in different ways in the following examples.

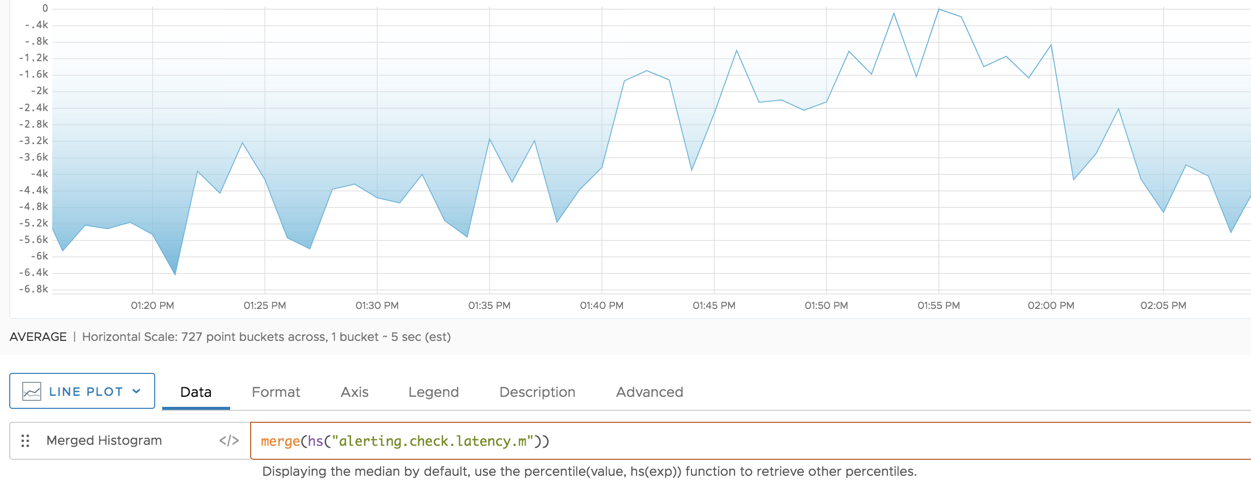
Example 1: Merged, no Grouping
Here we include all of the histogram series in the results:
merge(hs(alerting.check.latency.m))
Merging these histogram series combines the distributions “vertically” to produce a single series of composite distributions. The chart displays the results as a single line that consists of the median values of the composite distributions.
Example 2: Merged and Grouped by Source
Here we group the merged results to obtain a separate series of composite distributions corresponding to each source. This chart allows you to perform a source-by-source comparison of the median alerting check latencies.
merge(hs(alerting.check.latency.m), sources)
