Summary
timespan(<startTime>, <endTime>
    [, prettyName="<displayName>"]
    [, <eventTagKey>="<eventTagValue>"] ...)
Creates a single synthetic event with the specified start and end times, an optional display name, and any number of event tags.
Parameters
| Parameter | Description |
|---|---|
| startTime | Time when the new event starts.
You can pass in the time in seconds or milliseconds. |
| endTime | Time when the new event ends.
You can pass in the time in seconds or milliseconds. endTime must be of the same type (fixed or relative) as startTime. |
| prettyName="<displayName>" | Name to display for the new synthetic event when you hover over its icon on the X-axis of a chart. The keyword prettyName is case-sensitive. If displayName includes spaces, you must enclose it in double quotes.
Example: prettyName="Computer turned on" |
| <eventTagKey>="<eventTagValue>" | Event tag key and value to be associated with the new synthetic event. Specify multiple event tags by separating them with commas.
Examples: severity="info" details="traceID: 52ab47e" |
Description
The timespan() event creation function creates a single synthetic event that starts and ends at the specified times. You can optionally include a display name for the event, and any number of event tags. Synthetic events are displayed by the query, but not stored in Wavefront.
You can pass in the time in seconds or milliseconds.
Note: If you want to specify an event name that appears in the UI, you must use the prettyName keyword, for example, prettyName="myEvent". In contrast, a parameter like name="myEvent" associates an event tag with the event, but does not affect the event’s display.
Examples
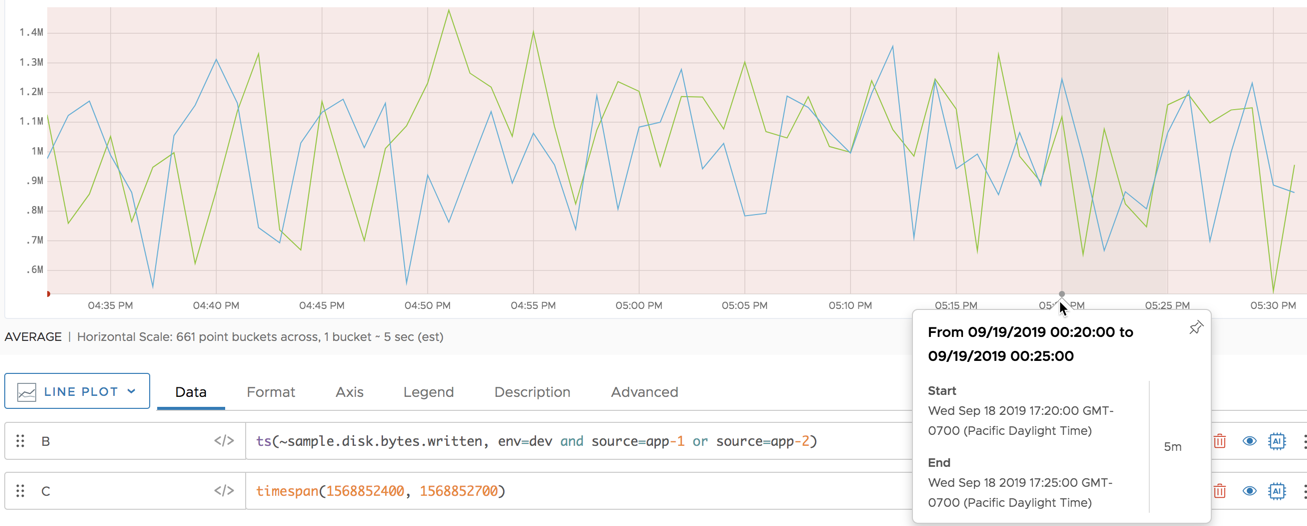
Fixed Start and End Times
The following chart shows a single 5-minute synthetic event that was created by specifying 2 epoch timestamps.
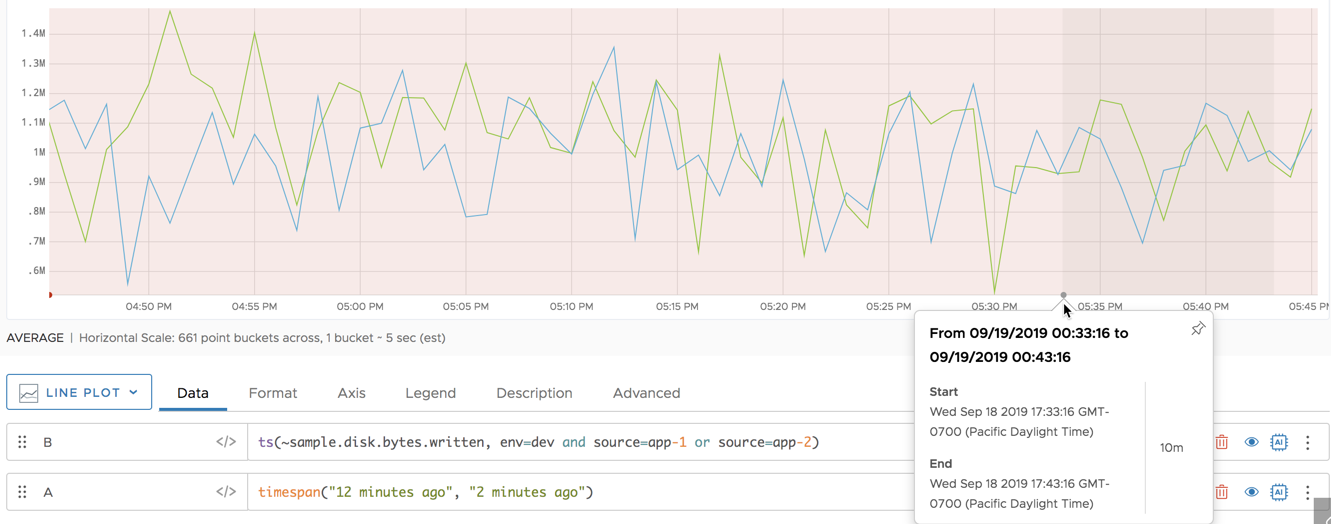
Relative Start and End Times
The following chart shows a single synthetic 10-minute event that was created by specifying 2 relative times. In a chart that displays live data, the start time of the event will always be 12 minutes before the end of the chart, and the end time will always be 2 minutes before the end of the chart.
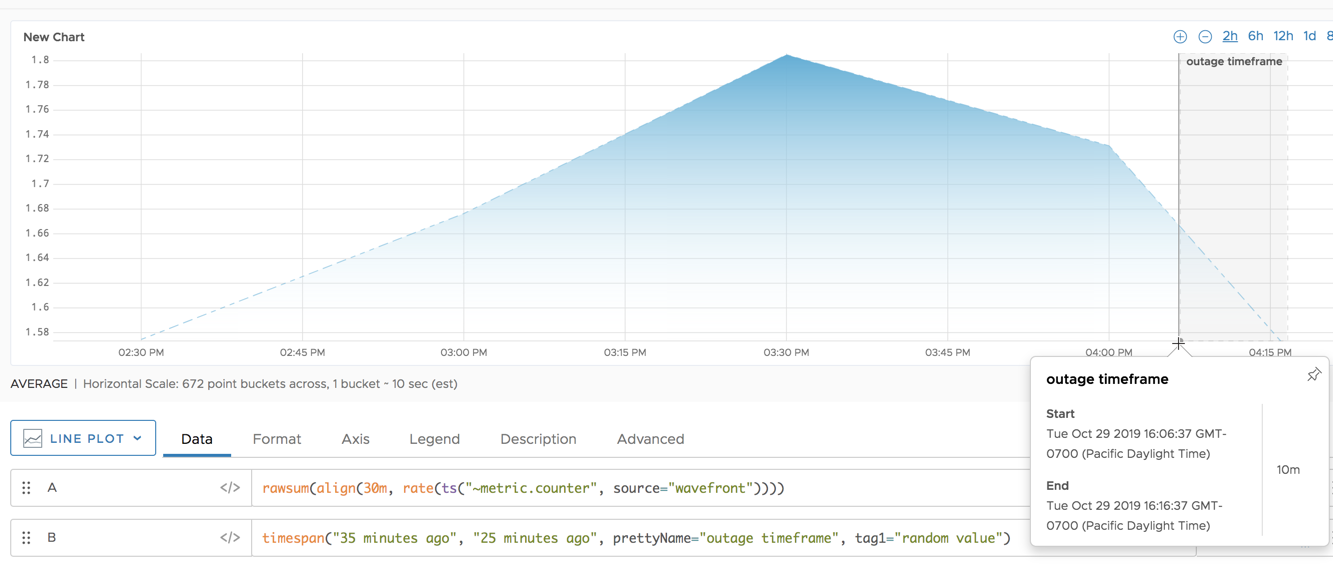
Display Name and Tags
The following chart shows a synthetic 10 minute event that has the display name outage timeframe. The display name appears in the event overlay and in the chart. The function also specifies an event tag called tag1, which is part of the event’s metadata, but not part of its display.