These release notes give an overview of the changes for the 2023-02.x to 2023-06.x releases of the VMware Aria Operations for Applications (previously known as Tanzu Observability by Wavefront) service.
2023-06.x Release Notes
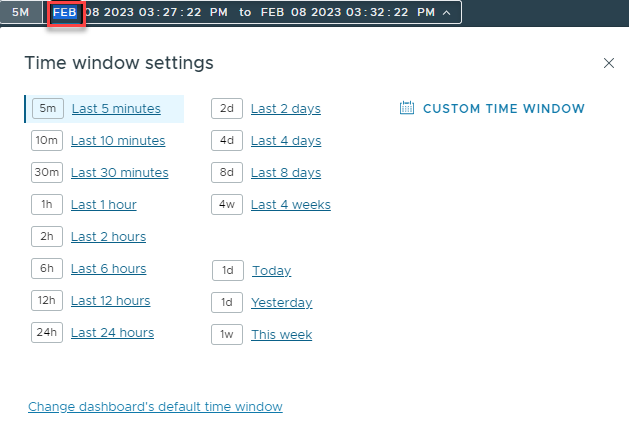
Time Window Picker Changes:
We have updated the time window picker for dashboards and charts to simplify the user experience.
|
 |
2023-05.x Release Notes
- See Who Has the Accounts Permission:
Users with the Accounts permission can manage users, roles, and permissions. If you need changes in your groups, roles, or permissions, but you don't have the Accounts permission, you can now see the contact details of the users with this permission at the bottom of the Groups, Roles & Permissions page. 
-
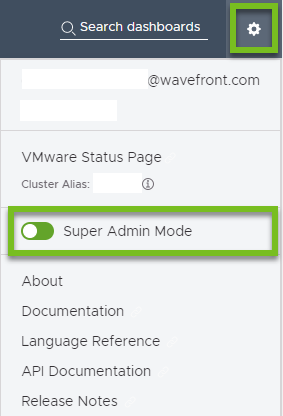
Super Admin Mode:
If you are a Super Admin, the Super Admin mode lets you turn on and off your own Super Admin privileges. You can enable Super Admin mode until you complete your Super Admin tasks. After that, to avoid making unintentional changes in the system, disable Super Admin mode. 
- Integrations: We had an integrations release in January! We made a lot of bug fixes and significant improvements to several integrations. See the Integrations Release Notes for details.
2023-04.x Release Notes
- OpenTelemetry: OpenTracing is deprecated. (OpenTracing and OpenCensus have merged to form OpenTelemetry.) To send trace data to Tanzu Observability, use OpenTelemetry.
- See the OpenTracing to OpenTelemetry Migration Guide to migrate a Java application that uses OpenTracing to use OpenTelemetry.
- Our OpenTracing SDKs are now deprecated, and are no longer supported.
- Spring Boot 3: The Wavefront for Spring Boot version 3.0.1 or later now uses Spring Boot 3.
- To learn more, see Wavefront for Spring Boot 3.
- Try out the Wavefront for Spring Boot 3 Tutorial and see how you can send your data in a few simple steps!
- See the Wavefront for Spring Boot FAQs to upgrade from Spring Boot 2 to Spring Boot 3.
-
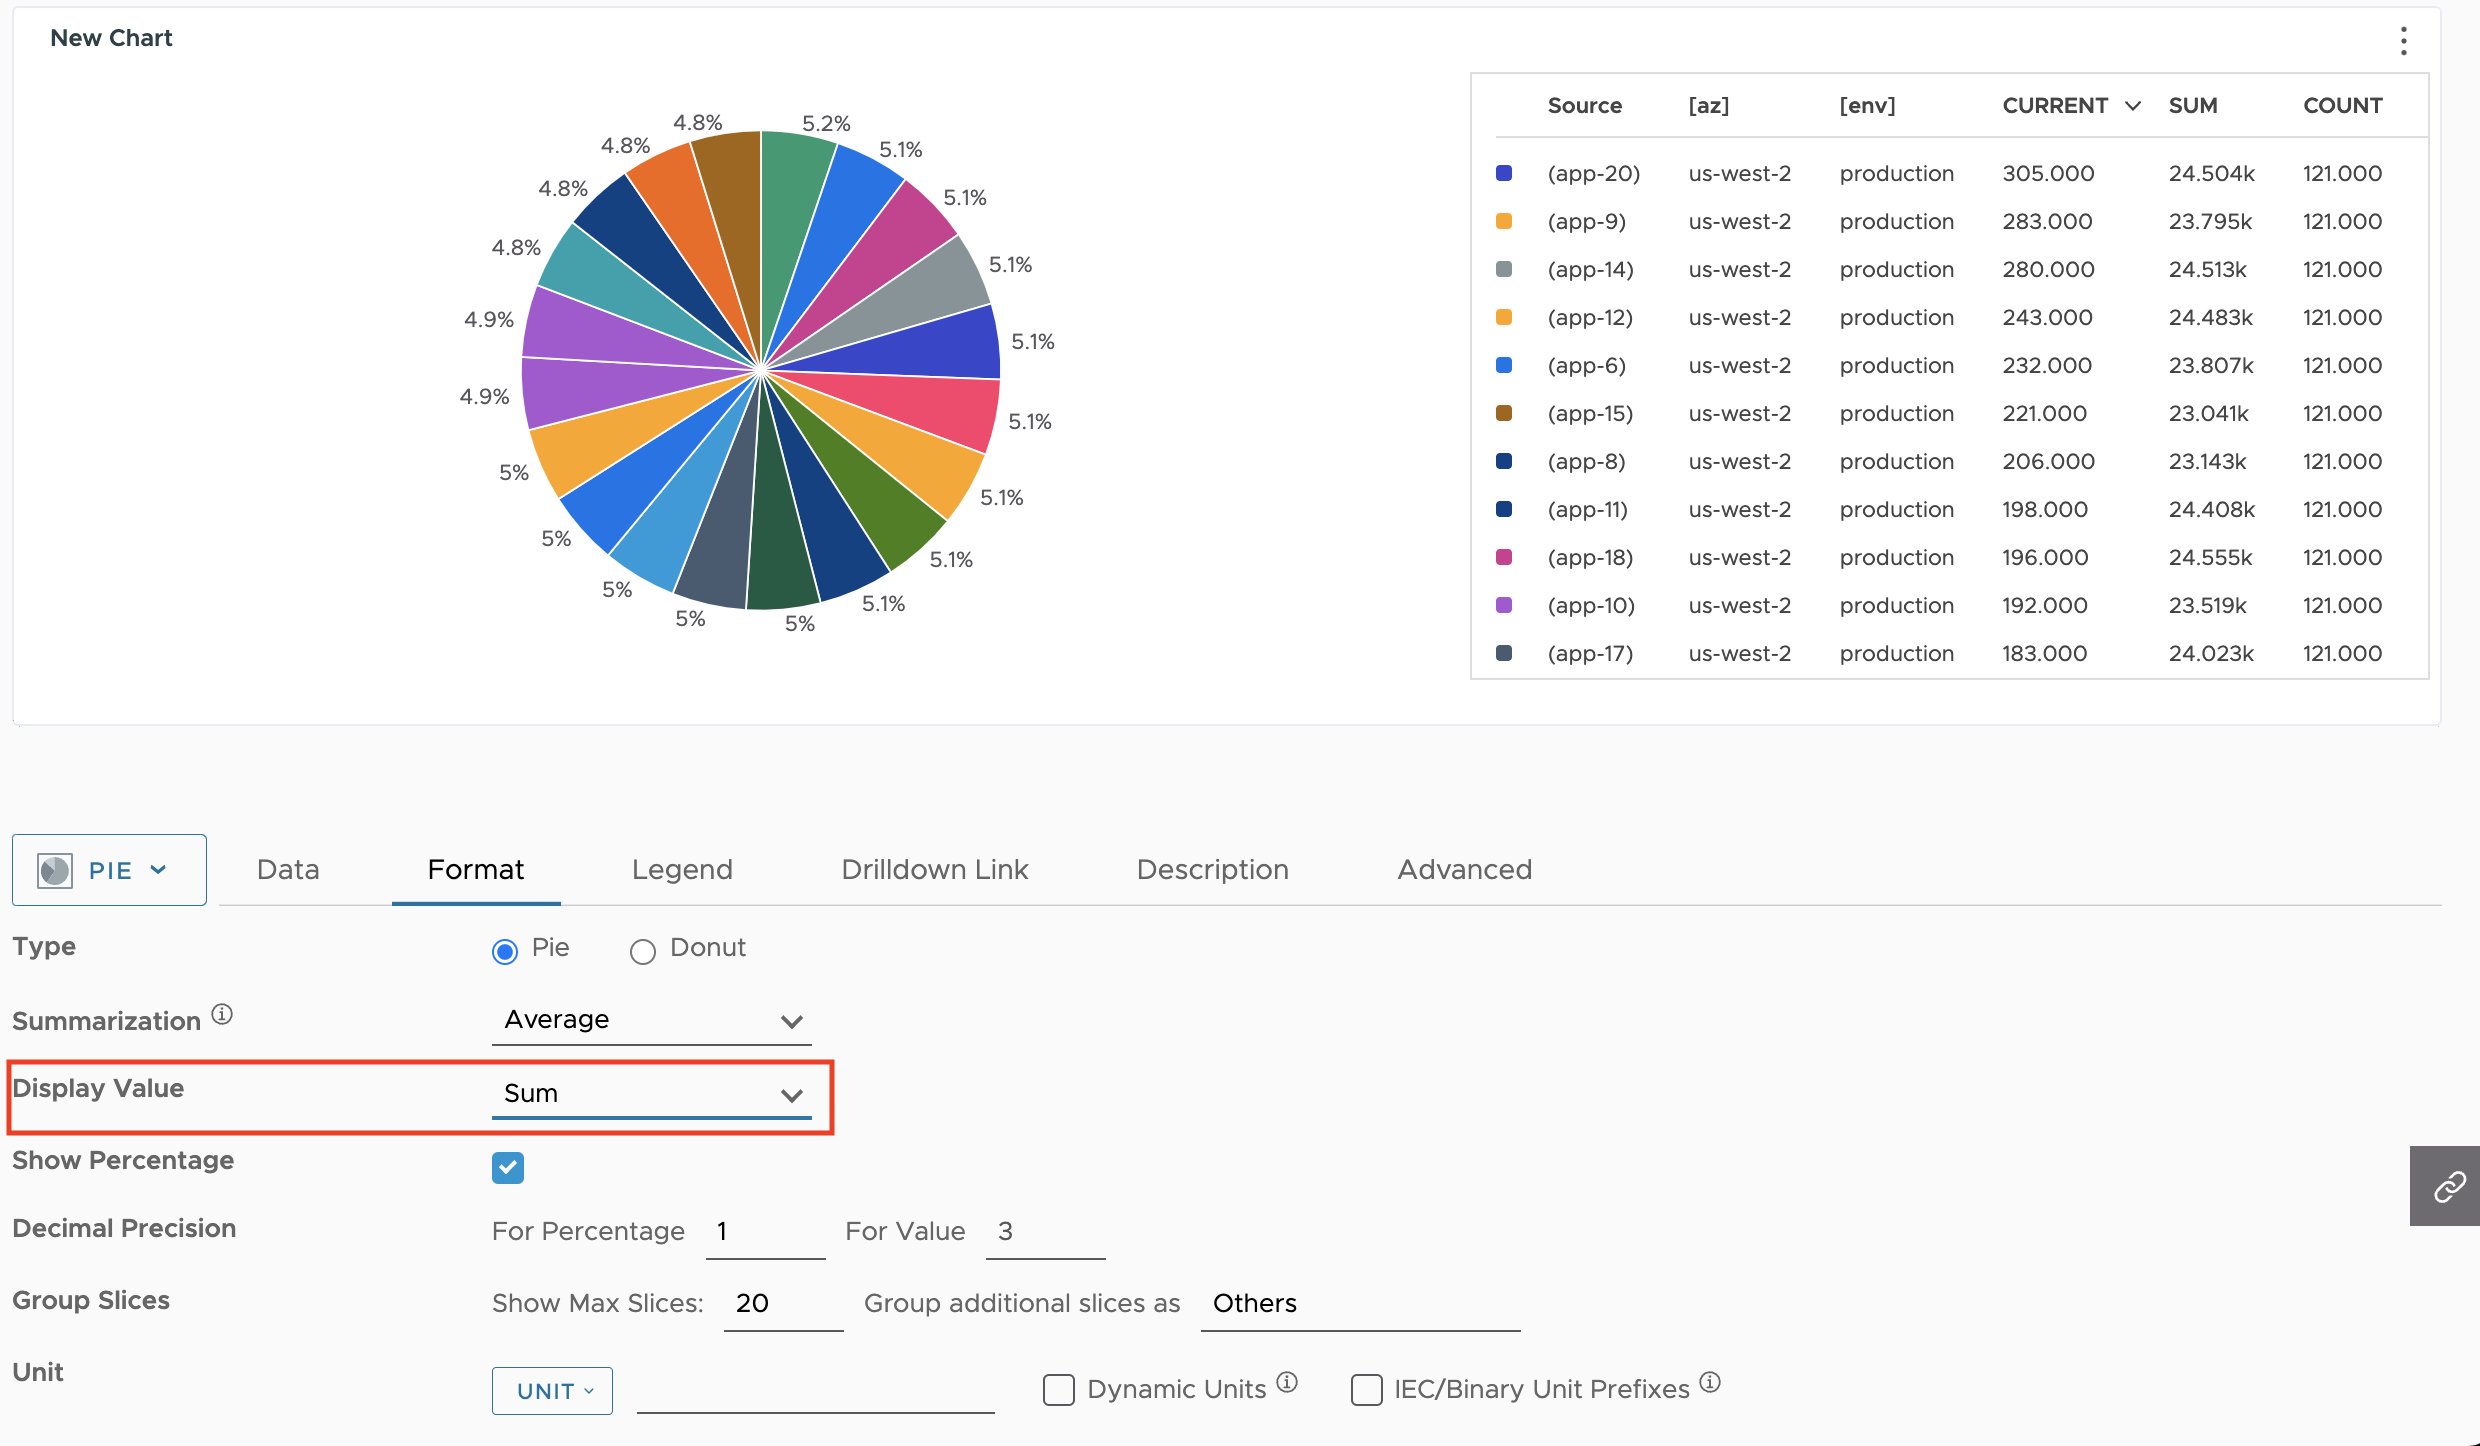
Charts Improvements: The pie chart displays the value for current, mean, median, sum, min, max, and count on the chart. For more details, see Chart References.
For example, if the query you use gets the CPU usage of all the applications, and you select Sum, you can see how the CPU usage of an application compares to all the other applications for a given time window.

2023-03.x Release Notes
- Alert Notifications Update: If your PagerDuty alert target is integrated with Slack, the alert notifications in Slack are now more extensive. They show the complete alert notification summary, which can be up to 1,000 characters.
2023-02.x Release Notes
- Charts Improvements: Stacked Area and Stacked Column charts are now supported with the latest Mozilla Firefox versions.