These release notes give an overview of the changes for the 2022-08.x to 2022-20.x releases of the VMware Aria Operations for Applications (previously known as Tanzu Observability by Wavefront) service.
2022-20.x Release Notes
|
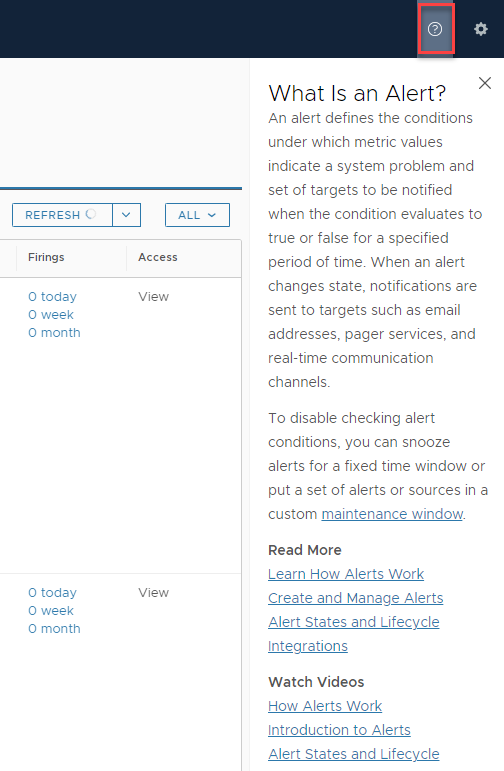
Improved Help Panel: You can now expand and collapse the help panel from the question mark icon on the toolbar. In addition, we have improved most of our help pages with the following sections.
|
|
2022-19.x Release Notes
This release includes the following improvements in Tanzu Observability components:
- Wavefront Proxy 11.1: The Wavefront Proxy is now using a 6 week release cadence. We made the following improvements to release 11.1 last week:
- Set span future fill limit to 24 hours: Spans sent with a timestamp that’s more than 24 hours ahead of the current timestamp will be blocked.
- Improved visibility for chained proxies: Client proxies chained to relay proxies now have visible status.
- Added new
metric_lengthmetric related to memory buffer. To view:ts(~proxy.*.metric_length.*) - Updated dependencies versions.
- OpenTelemetry metrics exporter: Send metrics data from your applications to Tanzu Observability using the Tanzu Observability (Wavefront) metrics exporter for OpenTelemetry, and use Charts and Dashboards to visualize the data.
- May Integrations Release: The May integrations release includes important updates to the Fluentd, Dynatrace, and Kubernetes integrations and other enhancements. See the Integrations Release Notes for details.
- Updates for Customers with Service Accounts in the Everyone Group: We removed all service accounts from the predefined Everyone group. With the previous release, we prepared for this removal, so that there’s no impact on any existing functionality and integration.
2022-18.x Release Notes
Updates for Customers with Service Accounts in the Everyone Group
Last year, we introduced the Service Accounts system group and added all service accounts to this group. To prepare for the upcoming removal of the remaining service accounts from the Everyone group, we did the following changes:
- For all dashboards and alerts that have the Everyone group in their view or view & modify access lists, we added the Service Accounts group to these lists. See Managing Access to Dashboards and Alerts for details.
- For all metrics security rules that have the Everyone group in their allow or deny access lists, we added the Service Accounts group to these lists. See Metrics Security Policy Rules for details.
- To preserve the current behavior for existing customers, we changed the default permissions for the service accounts to have view and modify access to newly created dashboards and alerts. To revoke these permissions for the service accounts, navigate to the Organization Settings page and on the Security tab, deselect the Service Accounts check box. See Change the Access Control Security Organization Setting for details.
2022-17.x Release Notes
|
API Tokens Management: Users with the Accounts permission can now view and revoke API tokens of any user or service account in the organization. See View and Manage the API Tokens in Your Organization for details. |

|
|
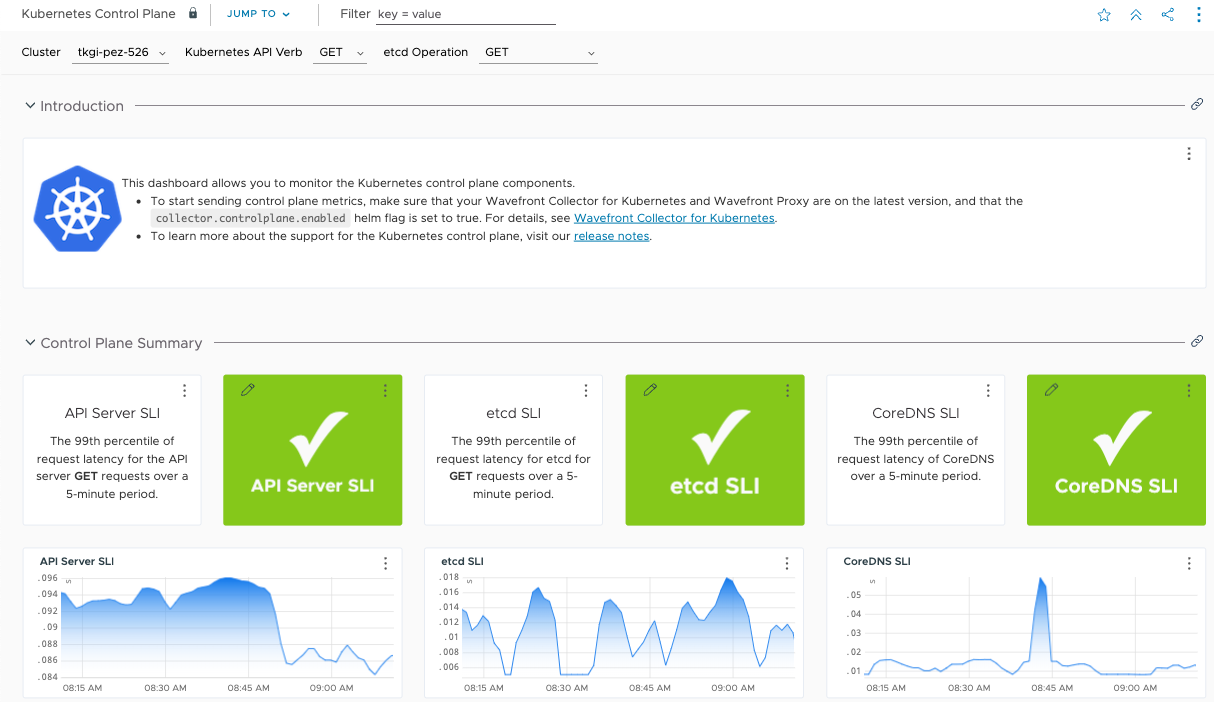
Full Support for Embedded Charts:
You can now embed all types of charts in other UIs. For example, you can embed a chart in an internal or external website. With this release, we have added support for embedding the following types of charts:
|

|
|
Chart Support in Alert Notifications and Other Systems:
We now support all types of chart images in all alert notifications, as well as Slack messages, etc. See the sample screenshot on the right. |

|
|
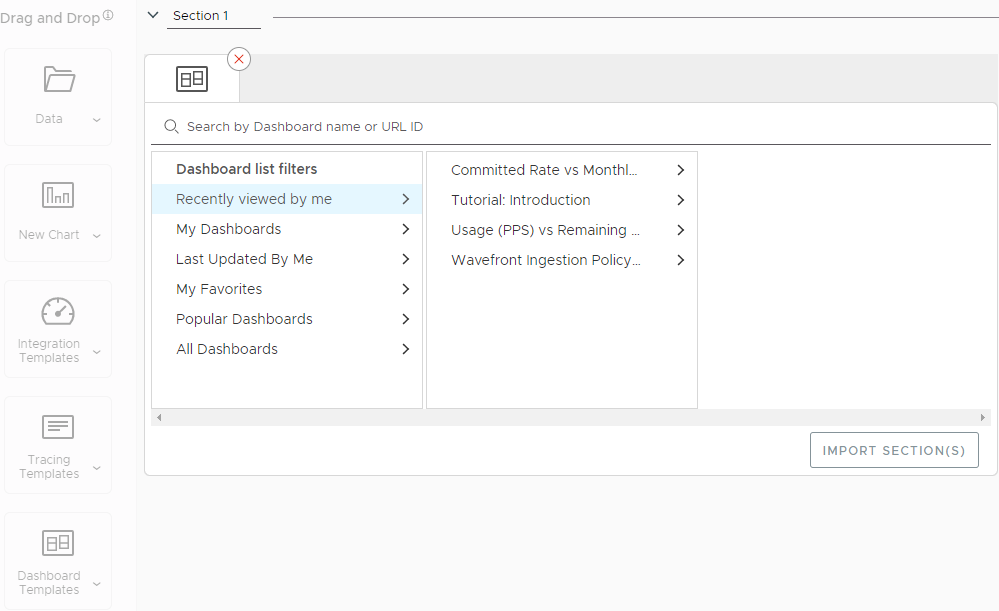
Importing Dashboard Sections From Other Dashboards: When you create or edit a dashboard, you can import sections from other dashboards. In dashboard edit mode:
|
|
|
Improved Charts Experience:
|

|
|
Documentation Improvements:
We updated the doc set with more information that comes from our Tanzu Observability SaaS Value Engineering team. Some information was added, some new doc pages are listed on the right. |
Read More:
|
2022-11.x Release Notes
Wavefront Proxy 11.0:
|
Read More: |
New integrations:
|
|
|
Documentation Improvements: We updated the doc set with information that comes from the Tanzu Observability SaaS Value Engineering team. Some information was added, some new doc pages are listed on the right. |
Read More: |
|
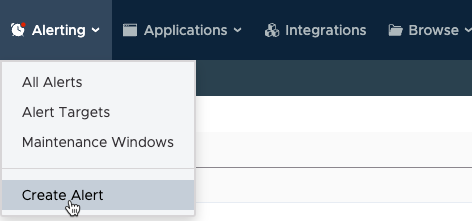
Toolbar Improvements: All objects and items related to alerts are available from the Alerting menu. Instead of clicking Browse on the toolbar to access alert targets and maintenance windows, you can click Alerting and select:
|
|
Improved User Experience for Slow Loading or Failed Queries:
|
|
|
Sorting of Columns in Pinned Legends: You can now sort columns in the legend for most chart types after you pin a legend in a chart (Shift+P). See the screenshot on the right. |

|
2022-09.x Release Notes
Drilldown Links on Charts Improvement: You can now use drilldown links to send users to a target section of a dashboard. See How Do Drilldown Links Work.
2022-08.x Release Notes
Usage Portal: As more teams use the Tanzu Observability by Wavefront service within an enterprise, the central team (Super Admins) needs a better mechanism to track their points per second (PPS) usage, manage consumption, and also put limits to manage costs.
We have now made monitoring of the ingested PPS much easier. As a Wavefront Super Admin, you can track and monitor how ingested data is used, whether you will be billed for more data, and whether you will need to request more data. You can also create ingestion policies and monitor how different accounts contribute to the PPS usage.
