These release notes give an overview of the changes for Release 2021-09.x to 2021-14.x of the VMware Aria Operations for Applications (previously known as Tanzu Observability by Wavefront) service.
Partial Regex Support
You can now filter metrics, sources, source tags, or point tag values by using a subset of regular expressions. For example, you can get data from the metrics that have request.latency as the common prefix and has the tag env=prod:
ts(/request\.latency.*/, env=prod)
For details and examples, see Partial Regex, Wildcards, Aliases, and Variables.
Tracing Features
- When you search for traces using the trace ID on the trace browser, your trace ID needs to be in UUID format (example: 00000000-0000-0000-1111-111111111111). If you copy-paste a trace ID that is not in UUID format, Wavefront transforms it for you. For details, see Search and Filter Traces on the Traces Browser.
- From the Application Status Table View, you can now drill down not only to the Service Dashboard or Traces Browser, but also to the Operation Dashboard. See Table View.
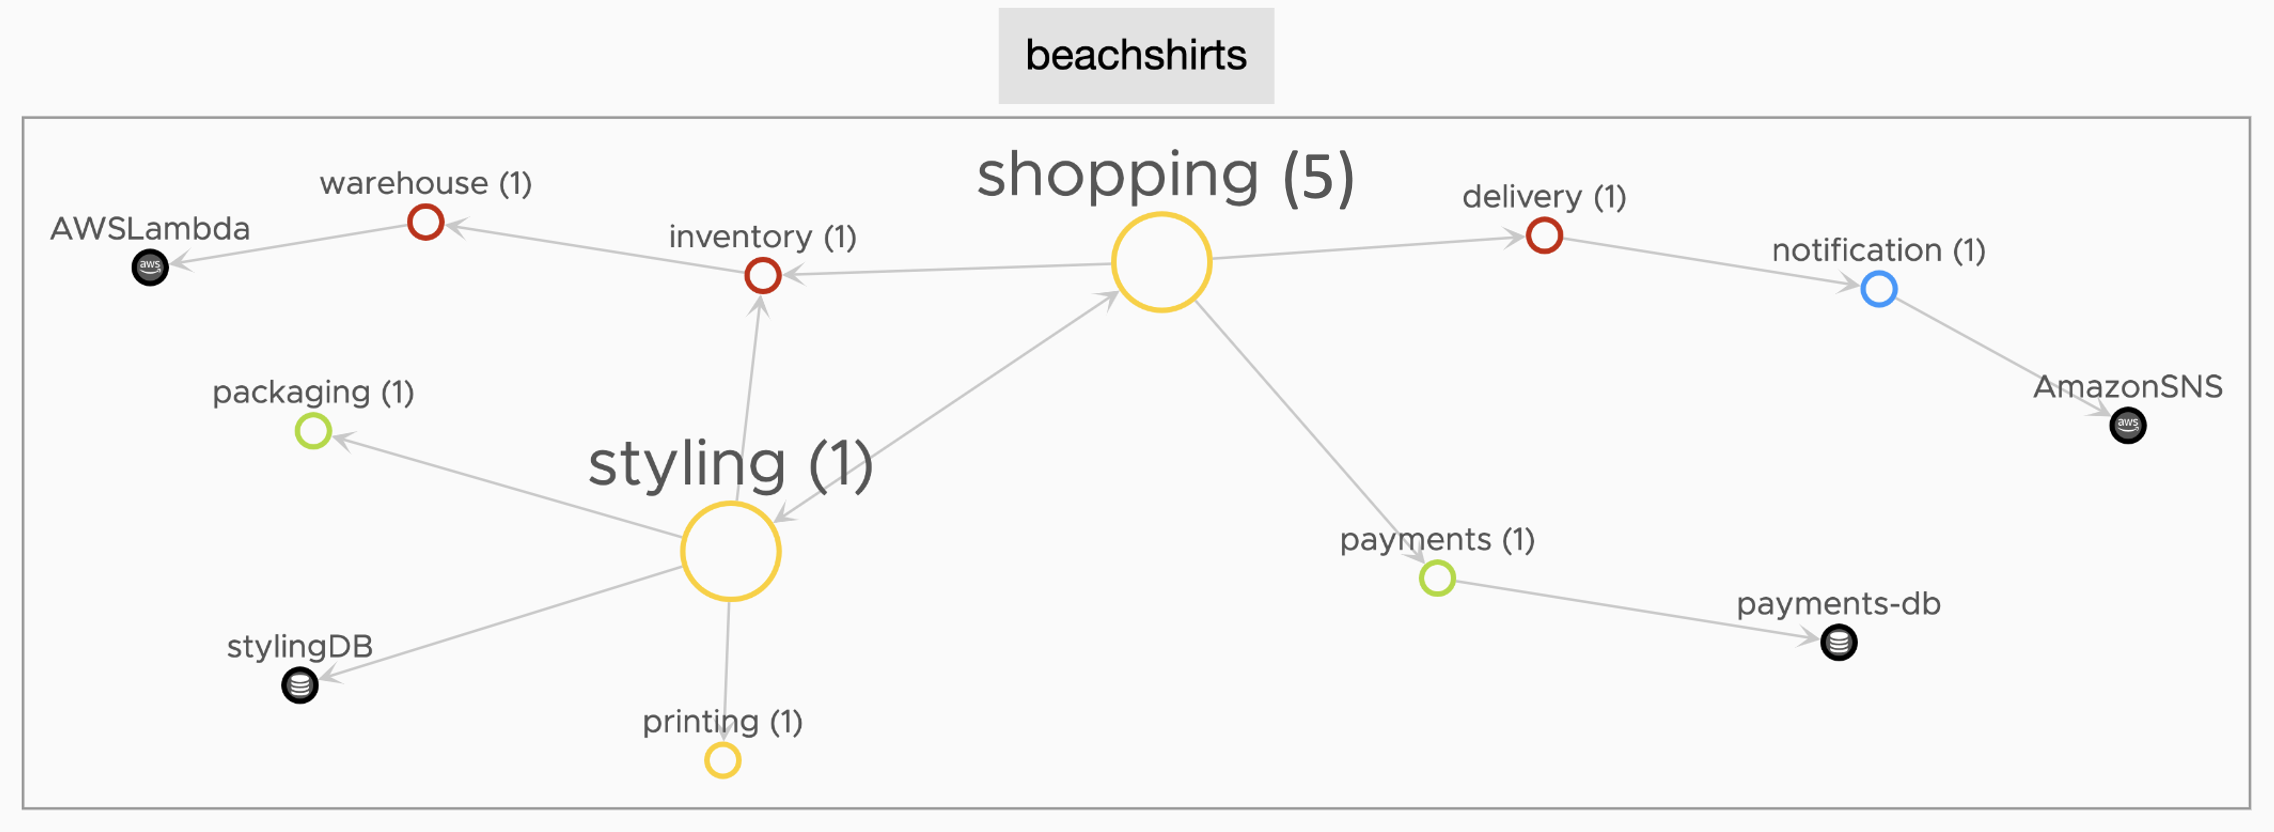
Application Map
- The Show Node Counts setting on the Application Map shows the number of instances of a service running in an application. For example, shopping (5) shows you that there are five instances of the shopping service in the beachshirts application.
- UI updates: You can right-click and open a link in a new browser window or tab.
Authorization Improvements
Super admin users can use the Wavefront REST API to sign out other users. See Sign Out a User.
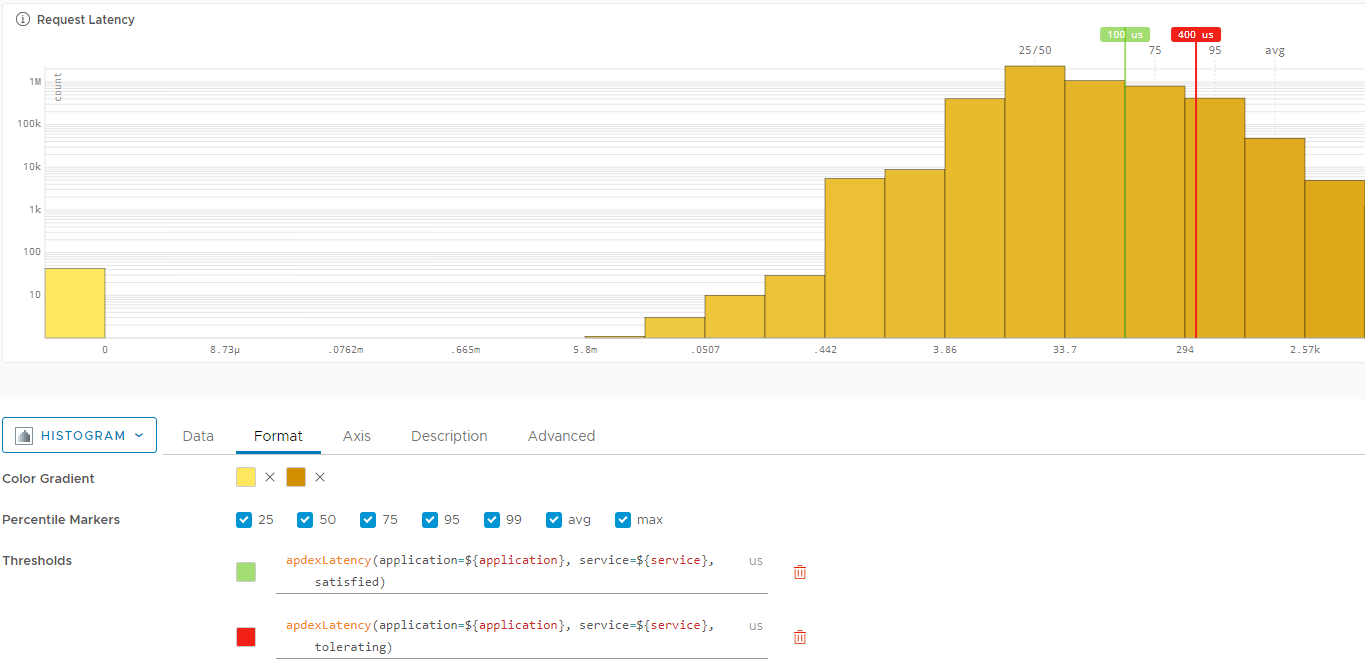
Histogram and Heat Map Chart Improvements
You can apply threshold markers to histogram and heat map charts as a variable that is defined by a query expression. See How Do I Set Up Thresholds for Histograms and Heat Map Charts.
Tanzu Observability Slug Generator
All the charts or dashboards in Wavefront have encoded URLs, which makes it easy for you to share these links with your colleagues. To help you take advantage of the charts and dashboards and allow easy automation and customization, Wavefront recently open sourced the Tanzu Observability URL slug generation code. See Introducing the Tanzu Observability Slug Generator.
Miscellaneous Improvements
- Ordering items displays them from the highest to the lowest. For example, when you navigate to the Alerts Browser and click Fired in the last month, the alerts are sorted from the highest number of firing to the lowest.
- Show Single Line Gradient on the chart settings allows you to turn off or turn on the single line color gradient.
-
UI updates: Updates in the Wavefront toolbar, which is now keyboard accessible:

- To navigate through the buttons in the toolbar, use the Tab key or the right and left arrow keys.
- To open a drop-down menu from the toolbar, select the button and press Enter or the down arrow. Then, use the down and up arrows to navigate through the list. To select an option, press Enter.
-
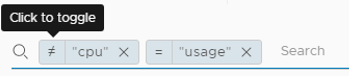
Exclude values from the search field by using the not equal sign. For example, you can exclude a keyword by entering it in the search field and clicking the equal sign in front of the keyword so that it turns to a not equal sign. For more information and examples, see Search Field.
Doc Updates
- Video about Ingesting Windows host metrics into Wavefront.
- New Hello Wavefront tutorial.