These release notes give an overview of the changes for Release 2020.22 of the VMware Aria Operations for Applications (previously known as Tanzu Observability by Wavefront) service.
Alert Viewer
Starting with this release, newly created alert notifications include a link to the new Alert Viewer. Existing notifications continue to link to the Alert chart, but you can edit those notifications to also (or exclusively) link to the Alert Viewer.
From the Alert Viewer, you can view related alerts, drill down to responsible point tags, see past firings of the same alert, and more. Let us know what you think!
Pie Chart
| The new pie chart lets you visualize data as pie slices or a donut. You can customize different aspects of this chart, for example, add a filter (Min, Max) or specify the maximum number of slices. The collage on the right shows both a pie chart and a donut chart for the same data. | 
|
Enhanced and New Query Language Functions
This release includes enhancements to the following existing functions:
- The
roundfunction now supports rounding to a specified multiple. - The
hwpredictive function now supports double exponential smoothing. It continues to support triple exponential smoothing as before. - The following standard time functions now support an optional second parameter (
<tsExpression>):day()month()year()weekday()hour()isToday()dayOfYear()
This release includes the following new functions:
- The
linearforecastfunction predicts the value of the time series using simple linear regression. - The
mslopefunction returns the per-second derivative of the linear regression of a time series over a specified time window. - The
clampMaxfunction changes any point greater thanmaxtomax. - The
clampMinfunction changes any point greater thanmintomin. - Two new standard time functions,
minute()anddaysInMonth()are now available. - The
mchangesfunction returns the number of times a metric changed value within a specified time window. - The
missingfunction checks whether there are any data points in a specified time window. - The
modarithmetic function returns the modulo of a division. - The two new
byandwithoutoperators simplify grouping with aggregation functions.
Tracing UI Improvements
Easily analyze your traces hierarchy and RED metrics by clicking the expand or restore icon.
- Click the expand icon to expand the RED metrics and view them next to the trace list and click the same icon again to restore to the default view.
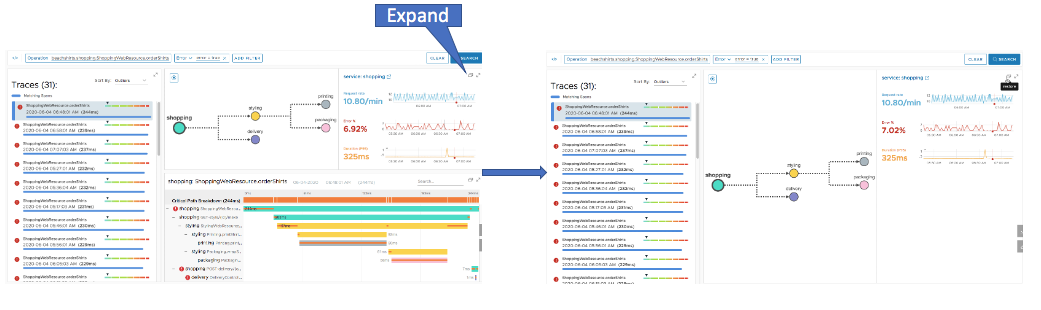
- Click the expand icon to expand the trace hierarchy and view them next to the trace list and click the same icon again to restore to the default view.

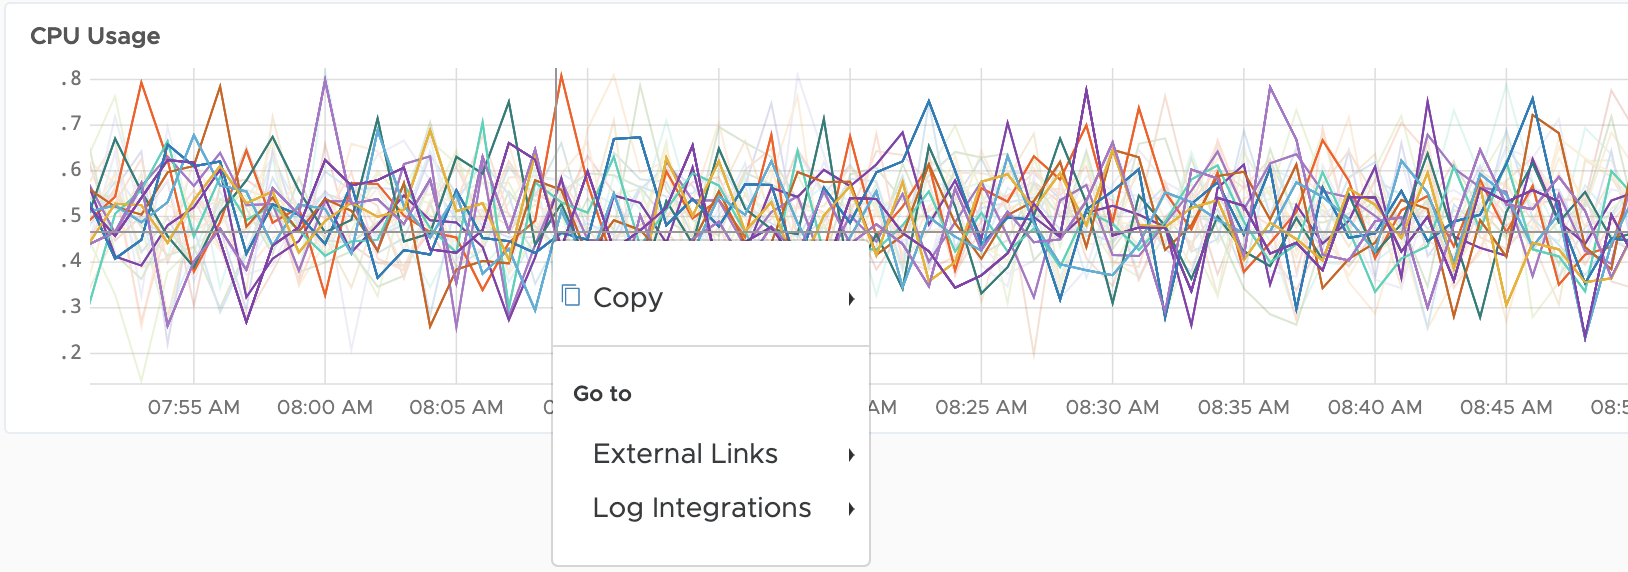
Log Integration
Troubleshoot anomalies on your metrics charts and drill down to view the logs that caused the issues. See Access and Examine External Logs for details.
Concurrent Query Limits
Wavefront enforces a limit on concurrent queries for each customer cluster. See Concurrent Query Limits for details and error messages.
Other Changes
We made several other improvements, some of them in response to customer requests:
Multi-Threshold Alerts Support Newline Character
For customers who use newline characters in alert conditions for better legibility, we now allow newline characters.
Export PDF Option
An Export PDF option is now available from any v2 dashboard and from charts in Edit mode.
| For any chart, Export PDF is now available from the ellipsis menu in the top right. | 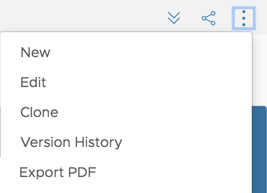 |
| Click on the chart name and select the Export PDF icon in the top right. |  |
Proxy 8.x
Wavefront Proxy 8.x supports incoming HTTPS connections and includes other miscellaneous improvement. See Wavefront Proxy Release Notes.
Queries for All Data
To improve performance, we no longer allow queries for all data, that is, you can’t query ts(*). Include at least one filter in any query.