These release notes give an overview of the changes for Release 2020.14 of the VMware Aria Operations for Applications (previously known as Tanzu Observability by Wavefront) service.
Wavefront for Spring Boot
Wavefront for Spring Boot allows you to quickly configure your environment, so Spring Boot components send metrics, histograms, and traces/spans to the Wavefront service. After you’ve completed setup, you can examine the data in preconfigured or custom Wavefront dashboards.
- Try out the tutorial and see how you can send your data to Wavefront in a few simple steps.
- To start from scratch, see Wavefront for Spring Boot on GitHub.
Dashboard Wizard and Chart Builder Support Histogram Option
| The dashboard wizard allows you to create a dashboard with one or more charts from data, charts, or integration templates. Going forward, if you select Data, you’re prompted to select metrics or histogram data. | 
|
| Chart builder allows you to select metrics or histogram distributions. | 
|
Histogram Heat Map Chart
This release supports a histogram heat map chart.
|

|
Application Map (Beta)
| Get an overview of how the applications and services are linked, focus on a specific service, and view Request, Error, and Duration (RED) metrics for each service and the edges in the application using the new application map. That’s not all, you can view traces for the services and edges and drill down from the application map. | 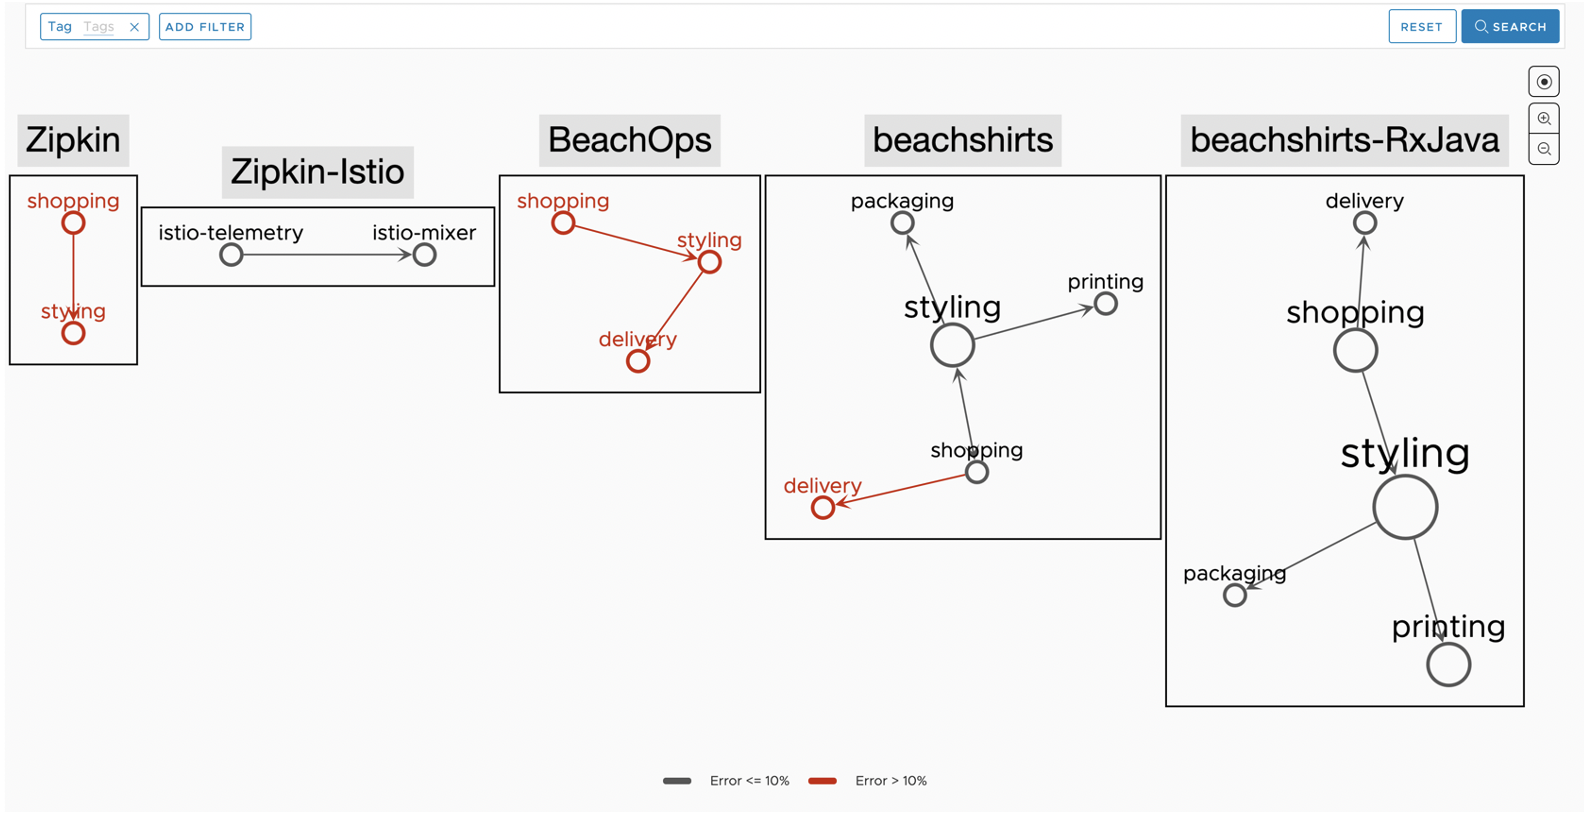
|
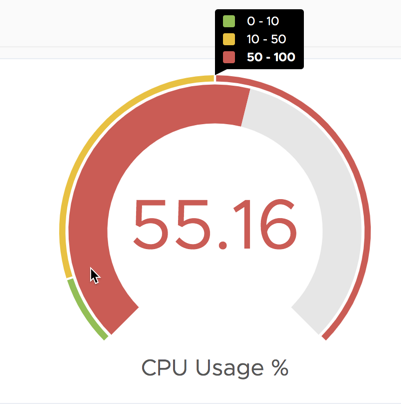
Gauge Chart
This release supports gauge charts, which are similar to single stat charts but allow you to show the possible values in an outer ring and customize coloring for that outer ring. |
|
Other Changes
We made several other improvements, some of them in response to customer requests:
Dynamic Variables Support Wildcard Character
| The values of a dynamic dashboard variable are determined by a query based on the state of the system at the time the query is executed. For example, that makes it possible for users to select all point tag values or specific point tag values from a dashboard that uses the variable. This release supports wildcards for all dynamic variable options (source, point tag, etc.). | 
|
Change in AWS Integration
The AWS integration now uses the newer CloudWatch GetMetricData API to collect metrics.
Proxy 7.0
We recently release Wavefront Proxy 7.0, which includes a significant number of new features. See Wavefront Proxy Release Notes.